ZHRNUTIE:

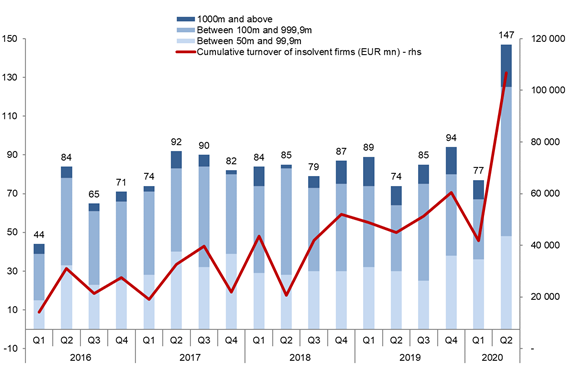
  • V druhom štvrťroku 2020 sa celosvetovo dostalo do platobnej neschopnosti až 147 veľkých spoločností s obratom nad 50 miliónov EUR, čo predstavuje nárast o 70 prípadov v porovnaní s Q1 2020 (+ 91%) a o 73 prípadov v porovnaní s Q2 v minulom roku (+99 %).
  • Kumulatívny obrat veľkých spoločností v platobnej neschopnosti vzrástol na 106,9 biliónov EUR (+ 155% v porovnaní kvartálov a + 138% medziročne).
  • Najväčší nárast bol zaznamenaný v západnej Európe (maloobchod, služby a automobilový priemysel) a v USA (energetika, maloobchod a služby).

VIAC SI PREČÍTAJTE V NASLEDUJÚCOM REPORTE V ANGLIČTINE:


In the second quarter of 2020, 147 large companies — with turnover above EUR50mn — went insolvent, representing an increase by +70 cases compared to Q1 2020 (+91% q/q) and +73 compared to Q2 of last year (+99% y/y). The cumulative turnover of insolvent major companies also surged to EUR106.9bn (+155% q/q and +138% y/y). All three sub-categories of companies we monitor by size of turnover posted a record level of major insolvencies : 22 cases in Q2 (+12 q/q) for those with a turnover exceeding EUR1bn; 77 (+46) for those with a turnover between EUR100mn and EUR1bn; and 48 (+12) for those with turnover between EUR50mn and EUR100mn. In this context, the average turnover of major companies becoming insolvent jumped to EUR727mn in Q2 2020 compared to EUR544mn in Q1 and EUR601mn in 2019.

Figure 1 – Number of major insolvencies* by quarter and size of turnover in EUR mn

Figure 1 – Number of major insolvencies* by quarter and size of turnover in EUR mn
(*) Companies with a turnover exceeding EUR50mn. Sources: Euler Hermes, Allianz Research

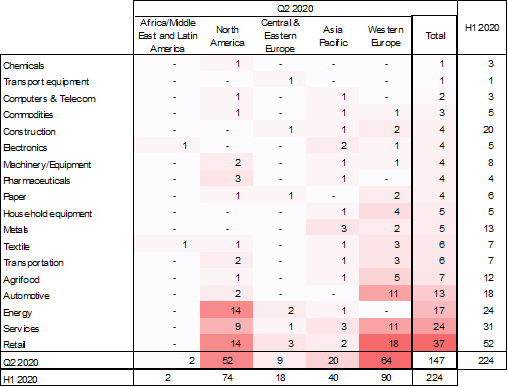
The largest surges were seen in Western Europe and the U.S. In Q2 2020, Western Europe posted the largest increase in major insolvencies to 64 (+38 cases q/q), ahead of North America, which recorded 52 cases (+30 q/q). Western Europe also remains the largest contributor to the global insolvency count for the first half of the year with 90 cases (+21 compared to H1 2019), again ahead of North America with 74 cases (+43). Asia experienced a stable number of major insolvencies in both Q1 and Q2 (20 cases), pushing down the outcome for H1 to 40 (-7 cases y/y). At the same time, North America posted a noticeable rise in insolvencies of companies with turnovers exceeding EUR1bn, with 17 cases in Q2, after 6 in Q1. The U.S. tops the list with 20 out of the 30 largest insolvencies registered in H1 2020, ahead of China (5) and Singapore (2).

Retail, services and energy were the most impacted sectors,  but automotive also stood out with a noticeable increase in major insolvencies. Retail and services posted 37 and 24 major insolvencies, respectively (i.e. +22 cases q/q) and +17 q/q), followed by energy with 17 cases (+10 q/q). While there was a pause in major insolvencies in the construction sector, they accelerated in the automotive sector, which recorded 13 cases in Q2 notably in the automotive suppliers, retailers and car rental sub-sectors. The list of more resilient sectors remains pretty unchanged from Q1 with in particular chemicals, computer/telecom and pharmaceuticals – on top of transport equipment. However, the average size (in terms of turnover) of their insolvent companies was two to three times larger than the average in H1 2020.

Where are the hotspots in Q2 2020? Retail and services in Western Europe and North America, energy in North America and automotive in Western Europe. In Q2 2020, the highest number of major insolvencies was recorded in retail in Western Europe (18), ahead of retail (14) and energy (14) in North America, and automotive (11) and services (11) in Western Europe. Looking at the first half of 2020 as a whole, the outcome is pretty similar in terms of ranking and relative frequency in major insolvencies. H1 2020 posted the highest number of major insolvencies in retail (52 cases) and services (31). For both sectors, these were mainly in North America and Western Europe. Yet, two other sectors stood out with more than 10 major insolvencies by region: energy in North America (18) and automotive in Western Europe (14). Construction comes right after in all regions but North America.

What does this mean for companies? As the Covid-19 pandemic creates an insolvency time bomb, we expect a stronger risk of domino effects, notably on fragile providers along supply chains.

For our full insolvency outlook, see our recent report : Calm before the storm: Covid-19 and the business insolvency time bomb.

Figure 2 –  Number of major insolvencies* by sector and by region

Figure 2 –  Number of major insolvencies* by sector and by region
(*) Companies with a turnover exceeding EUR50mn. Sources: Euler Hermes, Allianz Research
Figure 3 – Number of major insolvencies*  in H1 2020 by sector and size of turnover in EUR mn
Figure 3 – Number of major insolvencies*  in H1 2020 by sector and size of turnover in EUR mn
(*) Companies with a turnover exceeding EUR50mn. Sources: Euler Hermes, Allianz Research
Maxime Lemerle
Head of Insolvency and Sector Research