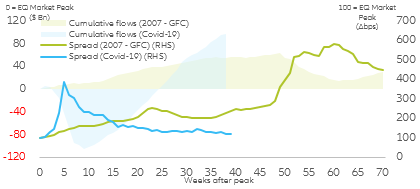
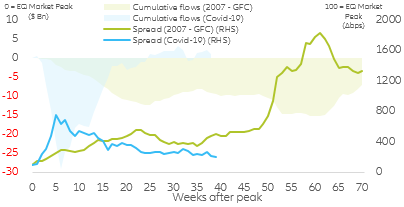
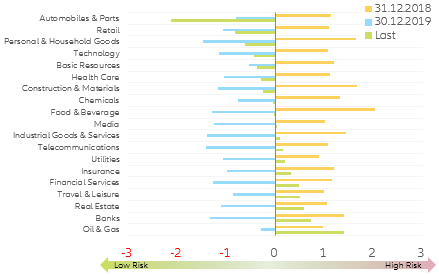
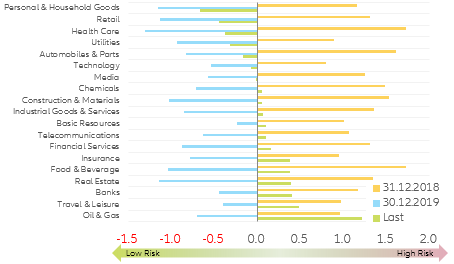
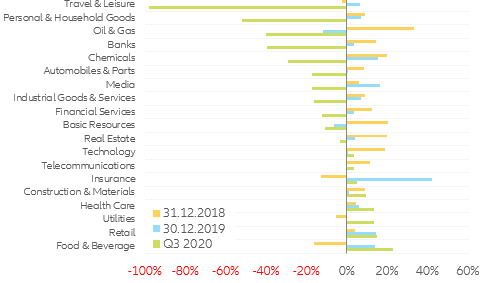
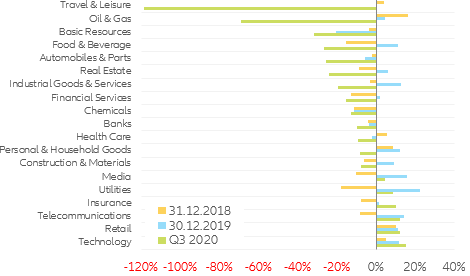
Traded companies have seen remarkable investment inflows even as prolonged Covid-19 lockdowns threaten corporate earnings and debt sustainability. These inflows have led to a substantial re-compression of corporate spreads, leaving most sectors trading close to January 2020 levels. Right after the initial March market sell-off, and aided by central bank actions, market participants rapidly shifted freshly cashed-out funds into both investment grade and high-yield corporate credit (Figure 1 & 2). As of today, the inflow into high-yielding debt has slowed down, while the investment grade universe is still the preferred asset class (mainly due to central bank support). However, the central banks support is not set to last forever as some Treasury secretaries (U.S.) are already claiming back funds dedicated to corporate credit purchases posing an imminent risk to corporate credit markets.
Figure 1: U.S. investment grade long-term fund flows
Sources: ICI; BofA; Refinitiv; Allianz Research
Figure 2: U.S. high yield long-term fund flows
Sources: ICI; BofA; Refinitiv; Allianz Research
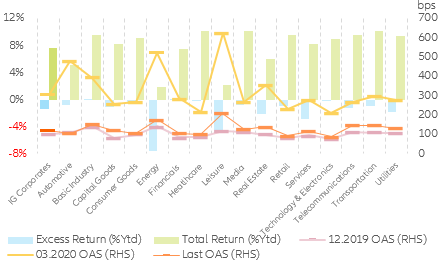
However, some sectors have attracted larger inflows than others: automobile, retail, healthcare and consumer goods have reversed most of the spread-widening experienced during the peak of the pandemic.
On the other hand, the sectors most affected by the Covid-19 crisis are still suffering from a structural deterioration of their credit quality (as depicted by the wider spreads), including leisure, energy and transportation
(Figure 3).
Figure 3: U.S. investment grade corporate credit return profile
Sources: BofA; Refinitiv; Allianz Research / OAS: Option Adjusted Spread
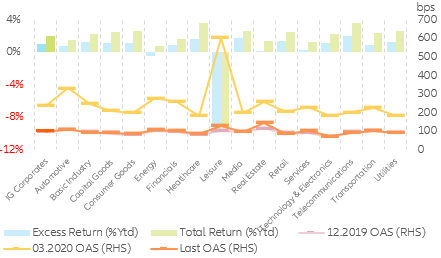
From a regional perspective, this extreme V-shaped market reaction has been more marked in the Eurozone, where most of the corporate credit risk has now completely reversed the initial widening. The only outliers of this reversal remain leisure and real estate (Figure 4).
Figure 4: EUR investment grade corporate credit return profile
Sources: BofA; Refinitiv; Allianz Research
We developed a combinational Z-score index that allows the combination of both equity and corporate credit market movements, and translates it into a proprietary market sentiment indicator. Following this methodology we are able to rank sectors based on the market’s risk perception / sentiment. Additionally, we have decided to weight both equity and corporate credit sectors as 50-50% irrespective of their relative market value weight within each asset class index as we believe markets are not currently looking at the structural differences in terms of investment instrument weights but rather at sectors and single names in isolation.
Following this methodology we derive that U.S. markets currently perceive oil & gas, travel & leisure and banks to be the most risky and least appealing sectors from a combinational equity + credit perspective. Interestingly, automotive, technology, retail and personal goods are the sectors perceived to be less risky or, in other words, the most crowded sectors (Figure 5).
Figure 5: U.S. sector market risk indicator (Z-score #std. dev.)
Sources: BofA; Refinitiv; Allianz Research
A similar pattern to that of the U.S. can be observed in the Eurozone.
Oil & gas, travel & leisure and banks are considered to be the most risky sectors within the EUR risky assets universe. Healthcare, personal & household goods, technology and retail make up the best performing sectors (Figure 6). Interestingly enough, there seems to be no particular outlier, as it is the case for the U.S. automotive sector, in the Eurozone.
Figure 6: EUR sector market risk indicator (Z-score #std. dev.)
Sources: BofA; Refinitiv; Allianz Research
But corporate credit pricing in isolation, as depicted in corporate spreads, is currently inconsistent with fundamentals, especially for sectors with high net leverage and low interest coverage ratios (travel & leisure, oil & gas etc.). From a cash-inflow perspective it is relatively easy to spot which sectors have been the most affected by the economic impact of Covid-19. As expected, in the U.S., cash flows into travel & leisure (-98%), oil & gas (-40%) and personal & household goods (-52%) have been the most hit by the global lockdowns, with EBITDAs deteriorating at an unprecedented pace. On the other side of the spectrum we find those sectors that have proven to be more resilient to general lockdowns, including food & beverages (+23%), utilities (+13%) and retail (+14%) (Figure 7).
Figure 7: U.S. realized EBITDA yoy% growth*
Sources: Refinitiv; Datastream Worldscope; Allianz Research
*yoy% change in 12m trailing EBITDA / Results smaller than -100% represent a negative EBITDA or outflow.
Lots of parallels can be found in EUR corporate sectors. From an EBITDA/cash flow point of view, travel & leisure (-118% due to negative EBITDA), oil & gas (-69%) and basic resources (-32%) have been the sectors most impacted by the lockdowns. Interestingly, the positive side of the EBITDA spectrum shows different drivers than those of the U.S., with technology (+15%), retail (+11%), telecommunications (+14%) and insurance (+10%) at the top of the earnings leaderboard (Figure 8).
Figure 8: EUR corporates realized EBITDA yoy% growth*
Sources: Refinitiv; Datastream Worldscope; Allianz Research
*yoy% change in 12m trailing EBITDA / Results smaller than -100% represent a negative EBITDA or outflow.
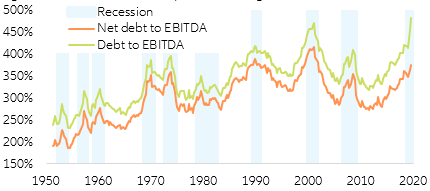
Just looking at the cash flow side of the balance sheet does not make the cut as the most important question remains unanswered. Are those cash flows sufficient to cover companies’ present and future debt commitments? This question becomes particularly relevant in a context in which despite the central bank’s efforts to support the economy, they do not have the capacity to directly purchase companies’ products to support a stable and prolonged stream of cash. This is especially true in the U.S. as companies have massively increased their debt commitments on the back of central bank support and market appetite (Figure 9).
Figure 9: U.S. non-financial corporates leverage
Sources: Refinitiv; Allianz Research, National Accounts (We exclude financials due to their particular balance-sheets)
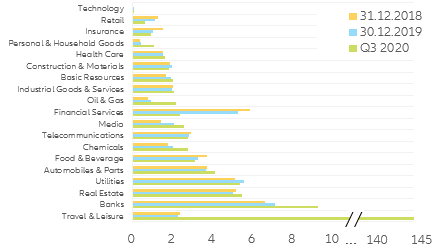
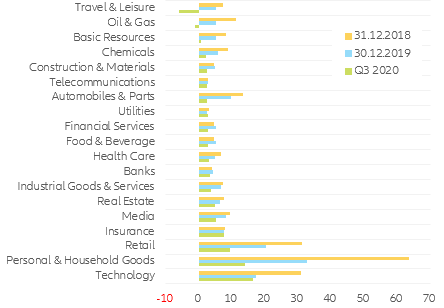
In order to get a clear overview of companies’ capacity to repay their debt commitments, we derive the net leverage ratio for each of the sectors. This easy computation provides a broad overview on how many years it would take for a company to pay back its debt if net debt and EBITDA were to be held constant. Keeping this in mind, it is extremely striking to observe that due to the combination of an increasing debt load and an extreme decline in earnings it would take around 143 years for U.S. travel & leisure companies to repay their debt at the current earnings pace. Of course, this Q3 earnings reading should be temporary and rapidly reversed in the near future on the back of fiscal and monetary policies, and the unwinding of transnational lockdowns. Nevertheless, it shows the severity of the impact on the sector. At a more comfortable but still high level we find banks (9.24), real estate (5.45) and utilities (5.34) (Figure 10).
Figure 10. U.S. corporates net leverage
Sources: Refinitiv; Datastream Worldscope; Allianz Research
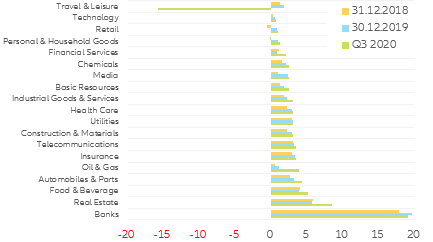
In the case of the Eurozone, the corporate leverage developments are far more striking as the travel & leisure (-15.8) sector’s net leverage is currently negative (due to negative EBITDA), meaning that at the current earnings levels it is impossible for companies to repay their debt commitments. Nevertheless, as it is the case for the U.S., this trend should be reversed in the near future. At a more comfortable but still extremely high level we find banks (19.61), real estate (8.46) and utilities (3.01) (Figure 11). As in the U.S., the Eurozone technology sector has little debt and lots of cash (Figure 11).
Figure 11 : EUR corporates net leverage
Sources: Refinitiv; Datastream Worldscope; Allianz Research
How do we know if the combination of an increasing debt burden and declining cash inflows poses an immediate risk for certain companies?
One way to answer this important liquidity risk query is to look at the interest coverage ratio . This ratio measures how many times a company can cover its current interest payments with its available earnings (we use EBIT instead of EBITDA to be more risk-oriented in our computations as it subtracts depreciation and amortization from the inflow calculation). In other words, it measures the margin of safety a company has for paying interest on its debt during a given period.
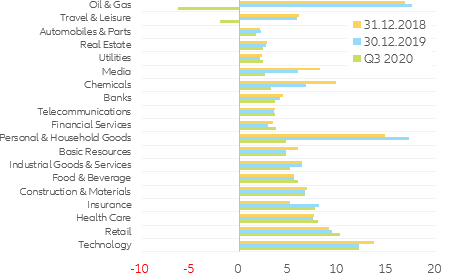
In the case of the U.S. corporate universe, as of today, the combination of a better than expected EBIT with a relatively low level of debt puts technology (12.11), retail (10.24) and healthcare (7.87) on top of the leaderboard in terms of the capacity to fulfill current debt commitments. On the other end, and even below the 1.5-1.0 tipping point, we find travel & leisure (-1.95) and oil & gas (-6.22). Once again, if companies in these extremely deteriorated sectors fail to “quickly” recover part of their lost inflows, it could lead to an accelerated wave of defaults and insolvencies depending on each company’s cash reserves.
However, even with such a deteriorated picture, central banks are still saving the day with their outright market funding. This is allowing companies with deteriorated balance sheets to refinance their pre-existing debt commitments. This “free” financing is a double-edged sword as it can lead to the zombification of a sector should that sector be unable to recover its earnings growth (Figure 12).
Figure 12: U.S. corporates interest rate coverage ratio
Sources: Refinitiv; Datastream Worldscope; Allianz Research
On the other side of the ocean things do not look extremely different. As it is the case for the U.S., in the Eurozone, the combination of a better than expected EBIT with a relatively low level of debt puts technology (16.21), personal & household goods (14.03) and retail (9.41) on top of the leaderboard. On the other end, and even below the 1.5-1.0 tipping point, we find basic resources (0.71), oil & gas (-1.21) and travel & leisure (-6.03). What’s more, the fact that the current situation has led to a rapid credit quality deterioration (rating downgrades) paired with central banks not buying any corporate credit below investment grade may pose an imminent risk to companies in such bad liquidity positions (Figure 13).
Figure 13: EUR corporates interest rate coverage ratio
Sources: Refinitiv; Datastream Worldscope; Allianz Research
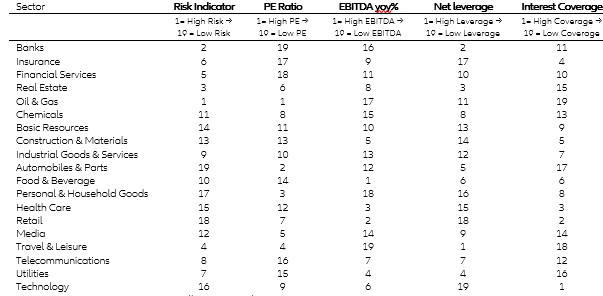
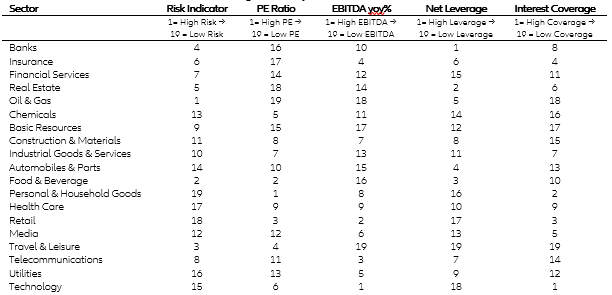
All in all, by combining both market sentiment and key parts of the balance sheet, we define a framework that allows us to spot the weak links of each risky asset investable universe (Table 1 & 2). In the case of both the U.S. and the Eurozone, it is pretty clear that travel & leisure and oil & gas are currently in extremely bad shape. However, markets seem to be mispricing the threat to both sectors as their corporate credit spreads remain extremely compressed due to both central bank and investors’ interventions. On the other side of the coin, technology and retail come out as the winners of the fundamentals and market sentiment race, which brings worries about those sectors being overcrowded.
Having said that, and consistent with our assessment, both ends of the valuation spectrum are currently being subject to extreme speculation and positioning. In the case of the technology and the travel & leisure sectors, the large speculative option positions seen throughout the year have brought large volatility spikes, making them, as of today, unsuited for mid- to long-term investment strategies but suited for speculative and/or technical trading. From a long-term investment perspective, it looks appropriate to optimize the risk-return profile by avoiding the sectors at the extremes and focusing on the more resilient part (the middle) of the investable universe.
Table 1. U.S. ranking summary table
Table 2. EUR ranking summary table


