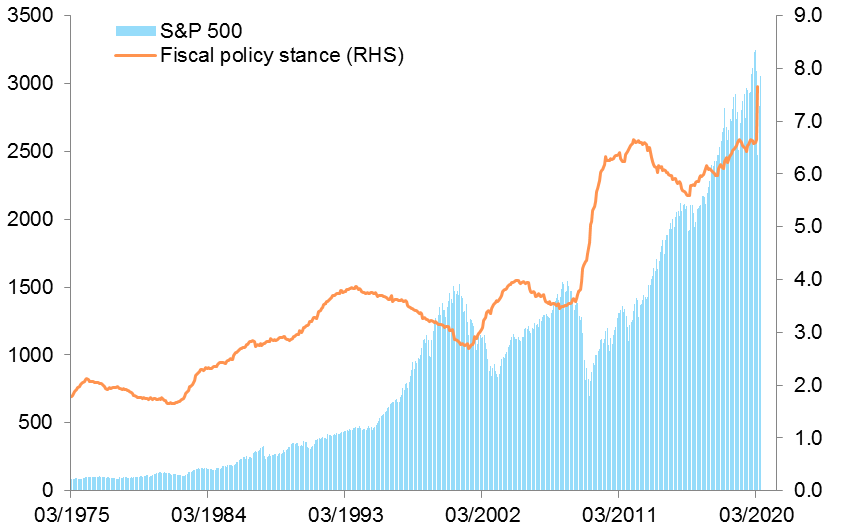
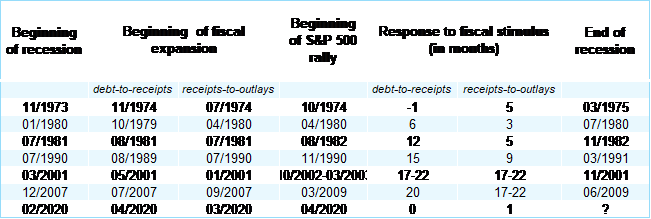
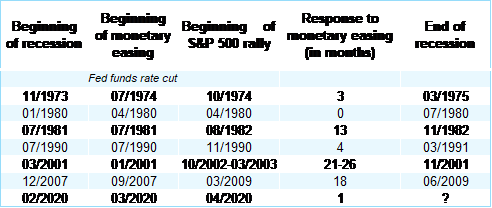
Historically, Wall Street has exhibited a propensity to respond positively to counter-cyclical monetary and fiscal policies. This is not surprising. After all, this is what textbook Keynesian economics, combined with rational expectations, is all about: when the private sector spends less, the public sector should borrow to spend more. Rational markets should expect such counter-cyclical behavior to stabilize the economy.
What is more surprising and worth noticing is that Wall Street is responding faster and faster to counter-cyclical policies, as if it was 100% sure that past experience is a sure guide to the future. In the context of the Covid-19 crisis, the response time of the U.S. and global equity markets to the beginning of the implementation of counter-cyclical monetary and fiscal policies has indeed shrunk to zero. Like Pavlov’s dogs, who tend to salivate before food is actually delivered to their mouths, markets seem to be acquiring a conditioned reflex whereby mere policy announcements seem to matter more than effective, successful and sustainable implementation. Paradoxically, the credibility of policymaking may have become a new source of vulnerability.
The rebound of equity markets since 23 March has surprised and wrong-footed more than one seasoned investor. It has indeed happened in the midst of data releases indicating the steepest and deepest recession since the Great Depression. Admittedly, equity markets have a well-known propensity to climb a wall of worries and to bottom out some months before the real economy recovers. But this time, the level of uncertainty seems unusually elevated, given the unique nature of the crisis. For example, once bitten, twice shy, the (many) private agents who entered this crisis with low cash balances might now be willing to hold larger cash balances: as suggested by Larry Summers, “just in case” is replacing “just in time”. This begs the question of knowing whether the usual monetary and fiscal multipliers apply this time.
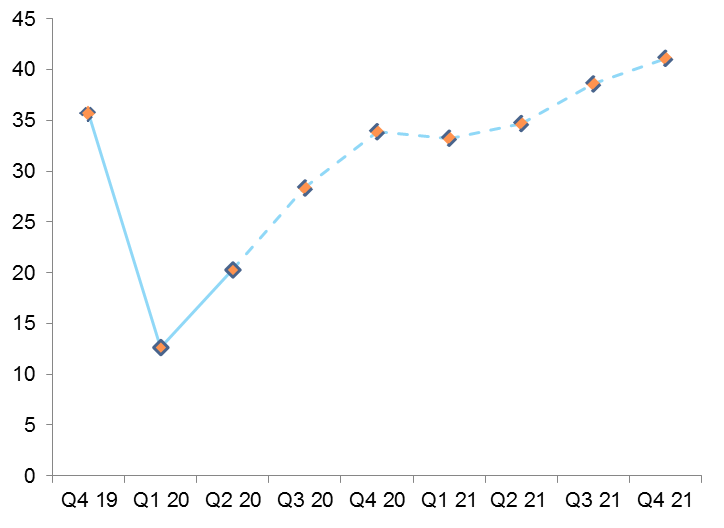
Notwithstanding such a potential headwind, markets have wasted no time to embrace a V-shaped scenario: to wit, for the S&P 500 the consensus expects earnings per share (EPS) to have almost fully recovered by Q2 2021 and to resume “normal” growth beyond (Figure 1).
In short, equity markets seem to behave as if there was no downside risk at the present juncture. Undoubtedly, this is testimony to the credibility of monetary and fiscal policymakers who have clearly shown, especially in the U.S, their readiness to do “too much, too early” rather than “too little, too late”. Policymakers in the U.S., the usual first movers, seem to have become so credible in the mind of global markets that they are able to trigger a conditioned Pavlovian global “Buy” response through mere announcements. By taking this posture, policymakers have been giving a master class in expectations management.
Figure 1 – U.S. equity market prices V-shape recovery
S&P 500 EPS, consensus forecast, in USD

