• Long-term nominal bond yields reflect expectations about the future course of policy rates. However, whether these expectations are adaptive or rational, backward- or forward-looking is at the heart of the matter. While there is robust evidence that long-term adaptive expectations are in the driving seat, we find that short-term rational expectations contribute to fluctuations around the trend.
  • We present an enhanced model that combines these two types of expectations, allowing us to assess what is already priced in long-term bond yields. As of 26 November, the estimated fair value of 10-year U.S. treasury bonds is 1.79%. Our model shows that 0.62% of that is contributed by the current Federal Funds rate, 1.24% by its perceived value and -0.07% by its expected short-term change (against -0.50% in early September). In other words, long-term adaptive (or backward-looking) expectations about policy rates keep short-term forward-looking expectations on the leash.
  • This was seen in early September, when, having very much bought the rumor that rate cuts were coming, the U.S. bond market sold the news when the FOMC actually cut the Federal Funds target. Expectations about the FOMC’s next moves are now subdued.
  • From a valuation point of view, our enhanced model confirms that the distribution of potential outcomes is now not skewed enough to warrant an aggressive positioning of portfolios in terms of duration.

For investors, one challenge is to forecast the future path of monetary policy. Quite another and a perennial one is to assess what is already priced into asset prices, especially bond prices. To answer this question, we look at the case of U.S. monetary policy and the yield on 10-year U.S. Treasuries. There are three reasons for this choice: Firstly, because of the role of the USD in the international financial system, U.S. monetary policy has a global reach and impacts all asset classes. Secondly, over the last year or so, speculation about the Federal Reserve’s next moves has been particularly rife. Finally, if, after many years of unconventional money policy, the Fed reverts to business as usual, its policy rates will again become its key policy tool.

To assess what is already priced in bond yields, we introduce an original analytical framework that blends forward-looking “rational” expectations with backward-looking “adaptive” expectations. We find  that the latter trumps the former and keeps them on a leash, suggesting that the current consensus about the course of  monetary policy in the next twelve months has little impact on long-term nominal bond yields: In sharp contrast to recent episodes, bond yields are not overly distorted by extreme expectations of tightening (as in October 2018) or of easing (as in September 2019). As a result, this situation does not warrant an aggressive positioning of portfolios in terms of duration.

Long-term nominal yields reflect expectations about the future course of policy rates

Developed capital markets offer fixed income investors a choice between instruments of different maturities and redemption yields. For example, the yield on a 10-year U.S. Treasury bond (1.74% as of 26 November, 2019) is typically different from the yield on a 1-year U.S. Treasury bill (1.59% at the same date), which is in turn typically different from the Federal Funds target rate, set by the Federal Reserve (1.75% at the same date). He who buys a 10-year UST bond today and intends to hold it until maturity locks in a 1.74% rate of interest until November 2029. This only makes sense if, right or wrong, he expects this 1.74% rate of interest to be at least equal to the average Federal Funds rate over the next ten years. If he does not expect this to happen, he is better off keeping his money in an overnight deposit, hoping that the reinvestment risk will benefit him.

But are such expectations rational or adaptive?

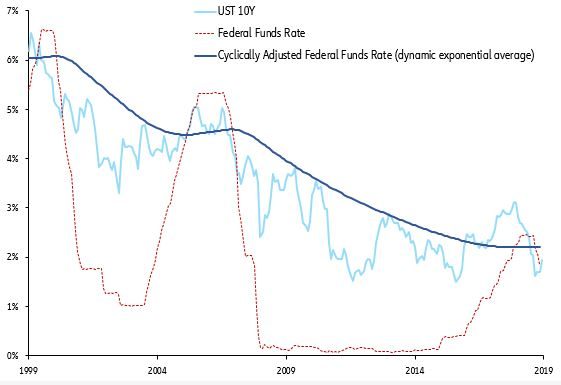
The buyer of a 10-year bond is therefore supposed to have an informed idea about the average level of short-term rates over the next ten years. Obviously, in the current state of our knowledge, this is out of reach. Hence, investors have a plan B: Keynes would say they use a valuation convention, which is to assume that the future will look very much like the past, subject to some adjustments reflecting the surprises that inevitably occur. Like it or not, the nominal yield on 10-year U.S. Treasuries is much more correlated with some historic average of the Federal Funds rate than with its current level. Put differently, long-term rates exhibit much more inertia than short-term rates, even when the Central Bank is quite explicit about its next moves. A case in point, shown in Figure 1, is what has come to be known as Greenspan’s conundrum. In February 2005, after the Fed had been hiking rates by 150 basis points in the nine months since June 2004, Alan Greenspan, the then Chairman of the Federal Reserve, found it puzzling that long-term bond yields had not risen or even fallen.


Figure 1: Greenspan’s Conundrum
Figure 1: 	Greenspan’s Conundrum
Sources: Refinitiv / Allianz research

Bond yields under the assumption that expectations are 100% backward-looking

Within this framework, the key issue is to use a smoothing algorithm that correctly describes the psychological process whereby investors transform memories of past policy rates into expectations about future ones. To that end, one can use Allais’s transformation, which is nothing but an exponential average where the rate of memory decay is time-varying and context-dependent: the larger the latest surprise, the larger the change in the weight given to the latest data point. The resulting variable  may be called the perceived policy rate or the cyclically-adjusted policy rate. Our initial model of the yield on 10-year UST (let’s call it 10Y-UST V1.0), which is very much inspired by the observations discussed above, was first estimated from December 1984 to December 2004. It yielded the following equation:

i=0.2868ff+0.7392z

where i is the yield on 10-year UST,  ff the effective Federal Funds rate, z its perceived (or cyclically-adjusted) value and ε the model residual.

Interestingly, the weight given to the cyclically-adjusted Federal Funds rate (0.7392) is almost 2.6 times the weight given the current effective Federal Funds rate (0.2868). What does that mean in plain English? It means that investors know that monetary policy is prone to cycles and that over a ten-year horizon, one is likely to go through at least one complete alternation of easing and tightening. Put differently, the current effective Federal Funds rate is expected to be unstable: it is some noise that should not distract investors from the long-term (or secular) trend in monetary policy.

Interestingly, too, the current value of the perceived Federal Funds rate is 2.18%, which is not very different from the FOMC longer run median projection (2.50% as of the end of September 2019).

Table 1: Inputs and outputs of model 10 year UST v1.0
Table 1: 	Inputs and outputs of model 10 year UST v1.0
Sources: Refinitiv / Allianz research
According to model 10Y-UST V1.0, the fair value of the yield on 10-year UST bonds is now 2.06%. As shown in Table1, 0.44% of that is contributed by the current Federal Funds rate, the remaining 1.61% by its perceived value. The trend trumps the noise. This estimated fair value of 2.06% is only 16 basis points above the current yield of 1.74%. In such a configuration, the distribution of potential outcomes is not skewed enough to warrant an aggressive positioning of portfolios in terms of duration.

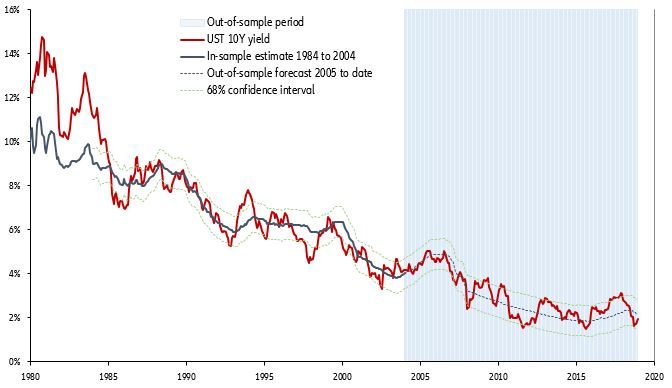
Model 10Y-UST V1.0 has quite a large standard-estimation error (the average value of  is +/- 69bips). But, as shown in Figure 2, it has proven remarkably stable out-of-sample, that is, over the last fifteen years. Whenever the actual yield has come close to +/- 1 standard-deviation error from its estimated value, it has retraced its steps reasonably fast. In other words, parsimonious as it may be, model 10Y-UST V1.0 has provided reliable buy- or-sell signals, the last two ones being a buy signal at 2.90% in Q4 2018 and a sell signal at 1.45% in September 2019.

However, this model does not factor in rational expectations about the short-term path of policy rates, the bread and butter of many an investment strategist or economist. Owing to Allais’s transformation, the model 10Y-UST V1.0 is admittedly more sophisticated than a classic exponential average, but its cardinal sin is to assume that expectations are 100% adaptive.
Figure 2:  Yield on 10 year UST and cyclically adjusted short-term rates
Figure 2: Yield on 10 year UST and cyclically adjusted short-term rates
Sources: Refinitiv / Allianz research

Bond yields under the assumption that short-term expectations are rational and long-term expectations are adaptive

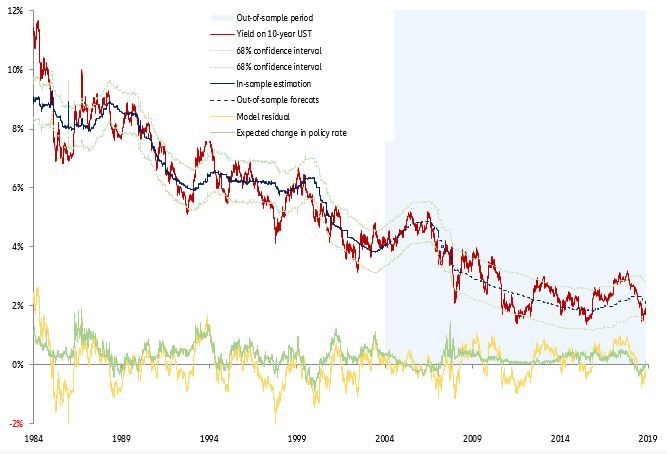
However, one observation suggests that adaptive and rational expectations may work together in determining bond yields. As shown in Figure 3, the residuals of model 10Y-UST V1.0 happen indeed to be correlated (and cointegrated) with the changes in the Federal Funds rate that are expected in the next six to 12 months. Unfortunately, one year or 18-months Federal Funds futures have not been actively traded for long enough to provide this information. But one can extract it from the forward rates implied by cash instruments, such as one-year and six-month T-bills. Expected changes in policy rates are estimated as the difference between forward and spot rates, for example the six-month rate six-month forward minus the six-month rate spot. If not totally “rational” in the technical sense of the term, such expectations are definitely more rational than adaptive, if only because of the increasing use of forward guidance by Central Banks.

Figure 3: Model 10Y-UST v1.0 residuals
Sources: Refinitiv / Allianz research

From there, it is only a small step to build a model 10YUST V2.0, which keeps the perceived policy rate as its cornerstone, but also incorporates the expected short-term change in short-term rates. The effect of this addition is to cut the standard estimation error from 69 to 45 basis points over the same estimation period (1984-2004). It yields the equation

i = 0.3992 ff +0.5703 z +1.4599 δ+ ϵ

where δ is the difference between the six-month euro-dollar rate six-month forward and its current value.

Table 2: Inputs and outputs of model 10 year UST v2
Sources: Refinitiv / Allianz research

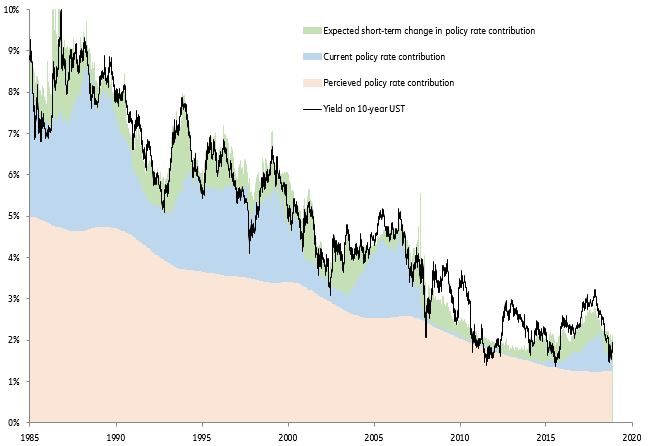
The weight given to the perceived Federal Funds rate is now “only” 1.46 times the weight of its current value. The weight given to the expected short-term change in the Federal Funds is the highest one, but it applies to a variable the order of magnitude of which is much smaller than the other two. As of 12 November, the estimated fair value is 1.86% (against 2.07% in model 10YUST V1.0). As shown in Table 2, 0.63% of that is contributed by the current Federal Funds rate, 1.25% by its perceived value and 0.00% by its expected short-term change (against -0.50% in early September). In other words, long-term adaptive (or backward-looking) expectations about policy rates keep short-term forward-looking expectations on the leash.

Model 10YUST V2.0 remains stable out-of-sample. It also does a much better job at explaining long-term rates in the 1960s and ’70s, when, owing to the then lesser independence and credibility of the Fed, markets were systematically pricing in more tightening “down the road” than they do nowadays.

Figure 4: Weighted contributions of input variables
Sources: Refinitiv / Allianz research

The value added by model 10YUST V2.0 is to measure what is priced into long-term rates in terms of monetary policy moves over the next six to 12 months.

Reading the current mind of the market

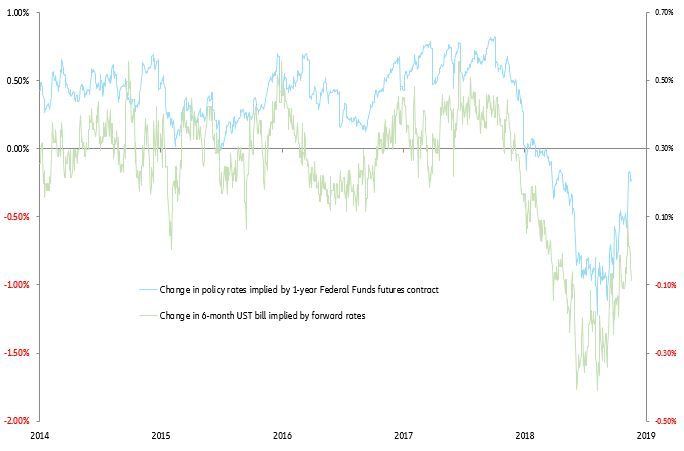
In early September of this year, according to Federal Funds futures contracts, market participants were expecting a 100 basis points decline in the Federal Funds rate (or four 25 basis point rate cuts) over the subsequent 12 months. According to the six-month T-bill yield six-month forward, they were expecting a 40 basis point decline in the six-month T-bill yield, the short-term expectational variable in our enhanced model. As shown in Figure 5, up to a linear transformation, these two time series very much tell the same story: In early September, market participants were expecting a significant easing of monetary policy.

Either they would be wrong-footed by the FOMC and long-term rates would rise, or they would be right and - by the Wall Street saying: “buy the rumor, sell the news”- long-term rates would still rise, albeit less than in the previous case. The distribution of potential outcomes was therefore skewed, irrespective of the news flow. According to this classic pattern, having bought a much telegraphed rumor, market participants sold the news when the FOMC cut the Federal Funds target twice, first in mid-September, second at the end of October.

Short-term expectations are now much more subdued and, as such, liable to be influenced by the news flow. From a valuation point of view, model 10YUST V2.0 confirms model 10YUST V1.0: The distribution of potential outcomes is not skewed enough to warrant an aggressive positioning of portfolios in terms of duration.

Figure 5: Butterfly short-term “rational” expectations
Sources: Refinitiv / Allianz research
Head of Capital Markets Research