Country Risk – Which countries are the most vulnerable to a global slowdown?

Country Risk – Which countries are the most vulnerable to a global slowdown?

March 13 2019
  • Annual global economic growth peaked in 2017-2018 and we forecast a soft landing of the world economy in 2019 and 2020. Against this backdrop, we studied the main transmission routes of a global slowdown to individual economies and identified countries that are the most vulnerable along three channels: external financing, trade and commodity prices.
  • Our analysis shows six countries are particularly at risk in the event of a (sharper than currently expected) global downturn: Argentina, Tunisia, Bahrain, Turkey, Jordan and Cyprus. Another 12 countries are “more vulnerable” and would require close monitoring should the global downturn turn out to be particularly strong. This list also includes one advanced economy: Italy.
  • As for emerging markets, many of them are more resilient to external shocks or a global slowdown than before the 2008/2009 Global Recession, thanks to better policies and the accumulation of sufficient foreign exchange reserves over the past decade.
  • Along the external financing channel, there are 18 economies that are notably more vulnerable than others. Eight of them are highly exposed to a global slump (including Argentina, Turkey, Cyprus and Tunisia).
  • Looking at the (merchandise) trade channel, we identify 45 economies (including many advanced economies) that are very export-dependent and thus are likely to experience a significant cyclical slowdown. Seven of these countries face higher systemic economic risks in the context of overall external liquidity, public and external debt ratios and macroeconomic policies (including Italy, Romania, Croatia and Vietnam).
  • Along the commodity prices channel, there are 11 important non-fuel commodity exporters (including Argentina and South Africa) and 14 important energy exporters (including Algeria and Oman) which are identified as more vulnerable to a global downturn.


Where we are now

Annual global economic growth peaked in 2017-2018. In our central scenario, we forecast a soft landing of the world economy, with global real GDP growth easing from +3.1% in 2018 to 3.0% in 2019 and 2.7% in 2020. The expansion of the volume of global trade in goods and services is projected to moderate from +3.8% in 2018 to +3.6% in 2019. However, there are considerable (and perhaps growing) downside risks to this relatively benign scenario because global trade tensions are still ongoing, for example, and stuttering growth in Germany and France may impact the economic performance of the whole of Europe. Meanwhile, slower growth than projected in China could affect other economies in Asia and elsewhere. Currently we assign a combined probability of 40% to downside scenarios in which the global slowdown will – sooner or later – be much sharper than in our soft landing scenario.

Against this backdrop, this article looks at the main transmission routes of a global slowdown to individual economies and identifies countries that are the most vulnerable along each of these channels. The three channels are external financing, trade and commodity prices. 

The analysis applies most of the economic indicators that are used in the underlying macroeconomic scoring model of the Euler Hermes Country Rating. However, it should be noted that while this exercise highlights potential stress points, it is not intended to be a predictor of the systemic collapse of a country. Neither is it a comprehensive assessment of country risk. That is contained in the overall Country Rating assigned by Euler Hermes’ in-house methodology, which takes into account important factors such as the business environment and government stability and effectiveness. This allows for the fact that some governments may already have begun to adjust policies to changing global realities or are in a strong position to take remedial action if needed.

Nonetheless, this analysis does highlight the economies which, in our view, could be hardest hit by suddenly tightening external financing conditions, absent appropriate policy adjustment, and/or through loss of export demand, compounded by poor policies and a weak external liquidity and debt position (again absent of appropriate corrective policies). It also indicates the more vulnerable economies should commodity prices fall unexpectedly sharply. It should be noted further that this analysis does not aim to identify a specific trigger for any potentially sharp or sudden global downturn – it rather provides a watchlist of susceptible countries should such a scenario materialize.

In other words, we think the Country Ratings of economies identified as more vulnerable are still appropriate at this point, but nevertheless those countries warrant close attention, particularly the larger markets. Should the global slowdown turn out to be more sharp than currently expected, it could tip marginal ratings into a higher risk category.


Vulnerability Channel #1: External Financing

As a starting point, we identify those economies with a large current account deficit.  The rationale is that the current account is the most often-cited “headline” measure of vulnerability. However, the current account in itself is not the whole story. A better measure of vulnerability is to set a large current account deficit in the context of:

  • overall external liquidity,
  • public and external debt ratios, and
  • macroeconomic policy indicators. 

Those countries most vulnerable along financial channels are the ones with wide current account deficits, weak external liquidity indicators overall, high debt ratios and already poor policy indicators. On the other hand, countries that have sufficient buffers with regard to external liquidity and debt and a solid policy performance are better positioned to withstand a sudden disruption to financing flows, even if they have a relatively large external deficit.

Table 1 shows those economies with a GDP of more than USD20bn that had an estimated current account deficit of more than -4% of GDP in 2018. Turkey has also been included in the table as it continues to face high downside risks, even though its external deficit is already in the process of rebalancing and has narrowed to below -4% of GDP after it experienced a serious currency crisis in 2018. Nonetheless, Turkey is not out of the woods yet, and its recovery could be disrupted by a global downturn.

Countries that have a High (H) or a combination of High (H) and Significant (S) risks in columns 1, 2 and 3 are the most vulnerable along the external financing channel of transmission and, other things equal, would require the strongest corrective action to avoid a crisis in the event of financing becoming suddenly more restrictive. Moderate (M) risk can be considered as a relatively mild early-warning signal, while Low (L) risk can be considered as relatively insignificant in this context.

Eight of the 24 countries in Table 1 flag a High (H) or Significant (S) risk in each of the columns 1, 2 and 3 (those highlighted in light orange). Apart from Argentina and Turkey, which are already in crisis, there are three countries from MENA, two others from Europe and one from Asia. This group of economies would be the most vulnerable if external financing would become scarcer in the event of a significant global slowdown and should be monitored closely then. It includes Cyprus, which currently has a Short-Term Country Rating of “2” at Euler Hermes, while the other seven are already rated “3” or “4”, reflecting high country risk.

Another ten of the 24 countries in Table 1 flag a High (H) or Significant (S) risk in two of the columns 1, 2 and 3 (those highlighted in light yellow). These economies – including Romania, South Africa, Algeria and Oman – would be more vulnerable and should be monitored more closely in the event of a particularly sharp (and sudden) global slowdown.

Table 1: External financing route vulnerability

Table 1: External financing route vulnerability
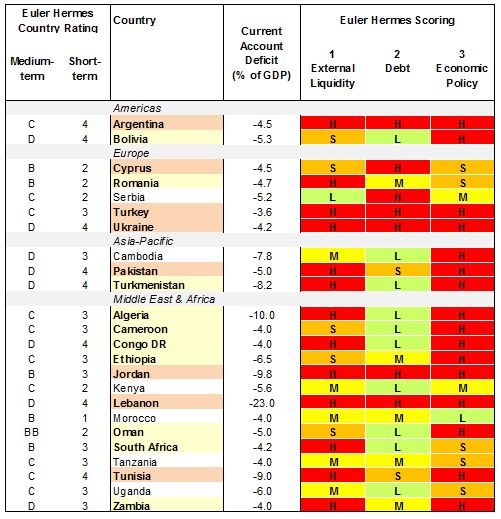
Sources: National statistics, IMF, IHS Markit, Euler Hermes

Vulnerability Channel #2: Trade in Manufactured Goods

The most pervasive trade effect is along the merchandise (goods) trade route. Merchandise trade can be divided broadly into trade in manufactured goods and trade in commodities. This section will identify countries with a GDP of more than USD20bn that are more vulnerable to the impact of a global slowdown in trade in manufactured goods. The countries likely to be affected through the commodities trade route are identified in the next section as price developments will be crucial. There is also a considerable and important trade in services, particularly tourism. This can be captured to some extent by looking at the overall openness of the economy to trade, measured by exports of goods and services as a proportion of GDP. Services receipts are taken into account in the Euler Hermes scoring indicators and therefore are reflected in the ability to cope with a downturn.

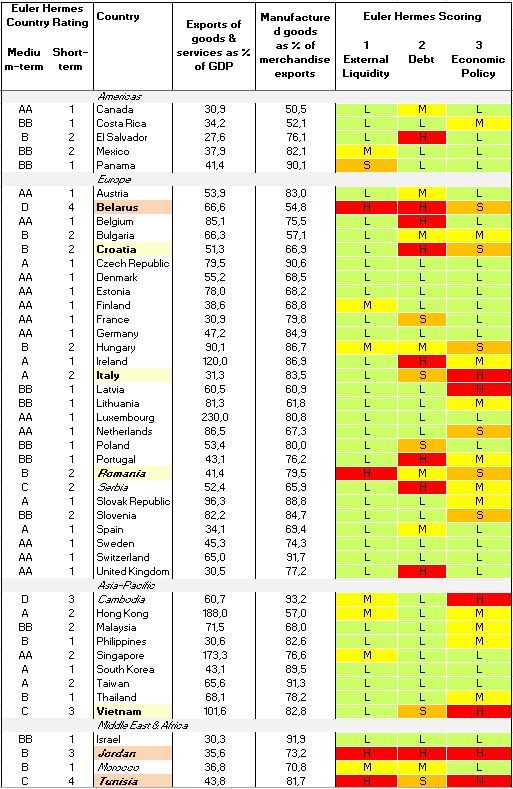
As a starting point Table 2 identifies 45 economies with a GDP of more than USD20bn, as well as high ratios of exports of goods and services to GDP (>25%) and manufactured goods in total merchandise exports (>50%), as the most exposed to a global downturn along the (merchandise) trade channel. It is likely that these countries, including many advanced economies, will experience a strong slowdown (relative to their recent growth rates), especially in the absence of offsetting policies. Some of them may even see a downgrade of their Short-term Country Rating as a result of increased cyclical risk.

We then look at the same groups of indicators as for the external financing vulnerability. In fact, six of the 45 countries here (those in italics) also appear in Table 1. Overall, however, only three of the countries in Table 2 flag a High (H) or Significant (S) risk in each of the columns 1, 2 and 3 (Belarus, Tunisia and Jordan). Another four flag a High (H) or Significant (S) risk in two of the columns 1, 2 and 3 ( Italy, Romania, Croatia and Vietnam). These seven economies face higher systemic economic risks along the trade channel in the context of overall external liquidity, public and external debt ratios and macroeconomic policies.

However, we can conclude that most of the countries in Table 2 – while among the more vulnerable to a growth slowdown via the trade channel – are relatively low risk as far as systemic problems stemming from a debt, banking or currency crisis, that would exacerbate the slowdown associated with weaker growth of export demand, are concerned. Moreover, as many of them indeed have sound policy indicators, low debt ratios and strong external liquidity positions, they may well be in a position to alleviate a downturn through offsetting domestic policy actions.

Table 2: Trade route vulnerability

Table 2: Trade route vulnerability

Sources: National statistics, World Bank, IMF, IHS Markit, Euler Hermes

Vulnerability Channel #3: Commodity prices

As for the commodity prices channel, we divided the vulnerability analysis into two sub-channels: (a) non-fuel commodity prices and (b) energy prices.

Non-fuel commodity prices

Here we identify those economies which are vulnerable to falls in non-fuel commodity prices. The outlook for these prices is uncertain and within this category of commodities there are important sub-groups that could take divergent tracks. Any sharp global slowdown will most probably weaken demand for metals and industrial raw materials. It is also possible that relatively high prices for many commodities over the past two years or so may have encouraged greater supply. That could add up to downward pressure on prices and weaker volume demand in the event of a global slowdown in the future. Other sectors, such as food and beverages, for example, are less influenced by the economic cycle, with food subject to the vagaries of the weather, among other things.

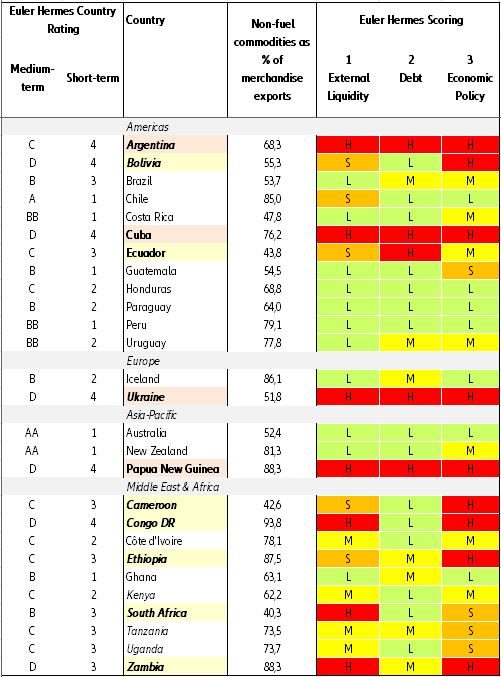
Table 3a shows 27 economies with a GDP of more than USD20bn and a high ratio of non-fuel commodities in total merchandise exports (>40%). These are the most exposed to a global downturn along the non-fuel commodity prices channel. Note that 11 of the 27 countries (those in italics, including some larger economies such as Argentina, South Africa and Ukraine) appear also in the external financing table, an indication that potential vulnerability beyond a slowdown would be almost inevitable if commodity prices fall (these countries already have a large current account deficit that is likely to widen in that event). Additionally, three further countries in Table 3a (Ecuador, Papua New Guinea and Cuba) that have not appeared in the previous tables flag a High (H) or Significant (S) risk in at least two of the columns 1, 2 and 3.

Table 3a: Vulnerability of selected non-fuel commodity producers

Vulnerability Channel #3: Commodity prices As for the commodity prices channel, we divided the vulnerability analysis into two sub-channels: (a) non-fuel commodity prices and (b) energy prices. #3a: Non-fuel commodity prices Here we identify those economies which are vulnerable to falls in non-fuel commodity prices. The outlook for these prices is uncertain and within this category of commodities there are important sub-groups that could take divergent tracks. Any sharp global slowdown will most probably weaken demand for metals and industrial raw materials. It is also possible that relatively high prices for many commodities over the past two years or so may have encouraged greater supply. That could add up to downward pressure on prices and weaker volume demand in the event of a global slowdown in the future. Other sectors, such as food and beverages, for example, are less influenced by the economic cycle, with food subject to the vagaries of the weather, among other things. Table 3a shows 27 economies with a GDP of more than USD20bn and a high ratio of non-fuel commodities in total merchandise exports (>40%). These are the most exposed to a global downturn along the non-fuel commodity prices channel. Note that 11 of the 27 countries (those in italics, including some larger economies such as Argentina, South Africa and Ukraine) appear also in the external financing table, an indication that potential vulnerability beyond a slowdown would be almost inevitable if commodity prices fall (these countries already have a large current account deficit that is likely to widen in that event). Additionally, three further countries in Table 3a (Ecuador, Papua New Guinea and Cuba) that have not appeared in the previous tables flag a High (H) or Significant (S) risk in at least two of the columns 1, 2 and 3.  Table 3a: Vulnerability of selected non-fuel commodity producers

Sources: National statistics, World Bank, IMF, IHS Markit, Euler Hermes

Energy prices

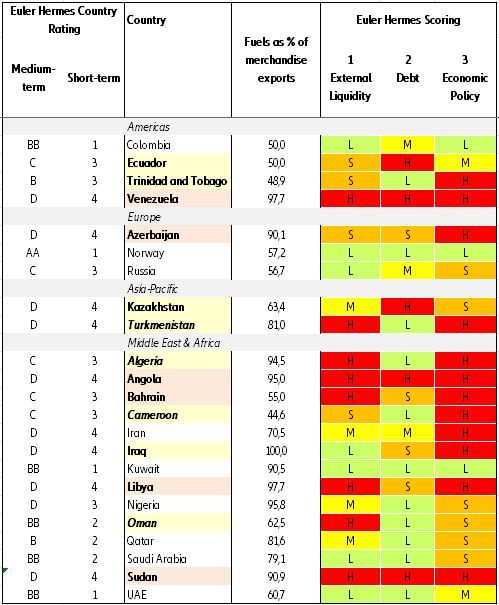
Finally, Table 3b identifies 23 energy producers and their dependence on energy exports. At this point, we do not expect a collapse in energy prices, though they have eased recently. However, should the global slowdown turn out to be stronger than currently forecast, prices could fall unexpectedly. In that event, all energy producers would suffer a marked deceleration of growth and some perhaps a recession. Several of them might experience a downgrade of their Short-term Country Rating as a result of the cyclical downturn.

The biggest potential problems, though, would be found among energy producers that already have significant external liquidity problems, as indicated by the same groups of indicators as for the external financing vulnerability. The six weakest economies along the energy prices channel (those highlighted in light orange in Table 3b) include five countries which are already in the worst Country Rating category (D4) assigned by Euler Hermes. The sixth country is Bahrain, which is currently rated C3. Bahrain was a victim of the extended period of low oil prices from end-2014 to 2017 and slid into a financial crisis at the end of 2017, after which is was provided with a USD10bn support package from neighboring GCC countries. Furthermore, there are eight economies in Table 3b that flag a High (H) or Significant (S) risk in at least two of the columns 1, 2 and 3 (those highlighted in light yellow). Three of them are already rated D4 but the other five countries (Algeria, Ecuador, Cameroon, Trinidad & Tobago and Oman) could be subject to a downgrade in the event that a particularly sharp global downturn occurs.

Note that the four larger GCC economies ( Saudi Arabia, UAE, Qatar and Kuwait) – which have much larger financial reserves in their SWFs than Oman and Bahrain – as well as Norway and Colombia face moderate to low external financing vulnerabilities. Even Russia and Iran appear relatively moderate in terms of risk along the external financing channel. But we need to keep in mind that these two economies face considerable financing risks along a particular channel, namely sanctions. Iran is already in a recession. And Russia could move back into recession should the existing set of Western sanctions against it be accompanied by a prolonged period of low oil prices.

Table 3b: Vulnerability of selected energy producers

Table 3b: Vulnerability of selected energy producers

Sources: National statistics, World Bank, IMF, IHS Markit, Euler Hermes

Roundup

Vulnerabilities to a global economic slowdown clearly exist and this analysis highlights those economies which could be the hardest hit, especially by a relatively sharp or sudden downturn, without appropriate corrective policies.

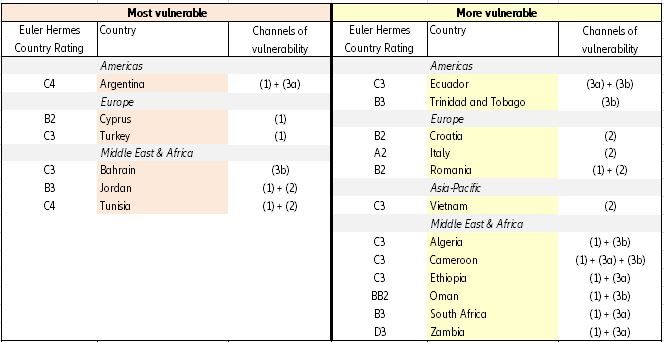
Summarizing along the three main transmission channels, and excluding those countries that are already in the worst Country Rating category (D4) at Euler Hermes, we have determined six countries as “most vulnerable” to a global slowdown: Argentina, Cyprus, Turkey, Bahrain, Jordan and Tunisia (see Table 4). Moreover, another 12 countries have been identified as “more vulnerable” and would require close monitoring should the global downturn turn out to be particularly strong. This second group includes some larger economies such as Italy, Romania, Croatia, South Africa, Algeria, Oman and Vietnam.

Italy and Cyprus are the only advanced economies identified as particularly vulnerable. We can conclude that other advanced economies – though many of them are exposed to a global slowdown along the trade channel – are relatively low risk far as systemic problems that could exacerbate a cyclical downswing are concerned.

As for emerging markets, many of them are more resilient to external shocks or a global slowdown than before the 2008/2009 Global Recession. That is because most emerging markets that were in crisis a decade ago have significantly rebalanced and improved economic policies thereafter which has helped accumulate sufficient foreign exchange reserves, notably in Central and Eastern Europe and in Asia (here the rebalancing actually began already after the 1997/1998 Asian Crisis).

However, it should also be noted that a number of predominantly commodity-exporting emerging markets have experienced a decline or even an erosion of their fiscal buffers over the past decade. This is because average commodity prices have been lower than before and most commodity exporters did not rebalance or embark on structural policies to reduce their dependence on commodities. Thus it is not surprising that ten of the 18 countries identified in Table 4 are major commodity exporters.

Table 4: Watchlist of countries particularly vulnerable to a global slowdown

Table 4: Watchlist of countries particularly vulnerable to a global slowdown
Sources: National statistics, World Bank, IMF, IHS Markit, Euler Hermes
Senior Economist for Emerging Europe and the Middle East
manfred.stamer@allianz-trade.com