• In March 2019, the spread between the long and short end of the U.S. yield curve entered into negative territory, sparking concerns about an economic downturn ahead. For the past 60 years, each U.S. economic downturn has been preceded by a yield curve inversion. While some may argue that this time it is different, our calculations show that implied recession probabilities range between 43-60%, hinting towards a very likely economic correction in the near future. Timing is however unknown.
  • Our long-term yields proprietary model shows that the current flat shape of the yield curve is likely to stay. Additionally, the current anchoring of the short end of the curve by the Federal Reserve at 2.5% plus the implicit stickiness of the long end of the curve, fairly valued at 2.5%, hints at the possibility of further yield curve inversion. The warning signs derived from the current and future shape of the yield curve suggest that a US economic downturn is probable. Investors need to look towards a downside risk-managing investment strategy.

Beware of the yield curve

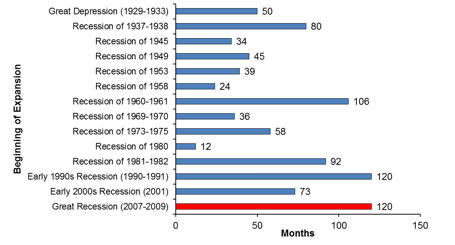
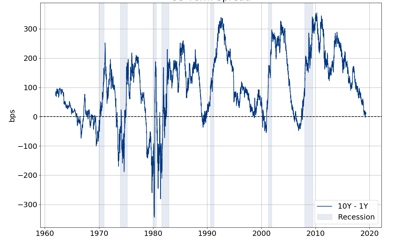
The US economy has just matched the longest cycle ever recorded in modern times (Figure 1). In this context, market participants are increasingly watching for a turning point, focusing on the inversion of the U.S. yield curve (i.e. when long-term treasury yields are lower than short-term treasury yields) as an indicator of the future economic outlook. For the past 60 years (earliest data point), an inversion of the yield curve heralded each economic downturn in the U.S. (Figure 2).

Figure 1: United States economic cycles          

Figure 1: United States Economic Cycles
Sources: National Bureau of Economic Research
Figure 2: US 10Y-1Y term spread

Source: Bloomberg, Allianz Research

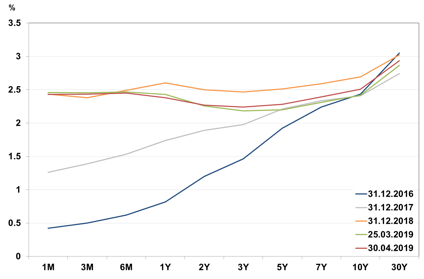
Through most of the current period of expansion, the yield curve has been on a flattening spree. As of the end of April 2019, the difference between long-term and short-term U.S. Treasury yields (term spread) stood at only 13bps and, most importantly, the yield curve inverted for six days between March 22 and March 28 2019 (Figure 3). 

Figure 3: US yield curve

Figure 3: US yield curve

Source: Bloomberg

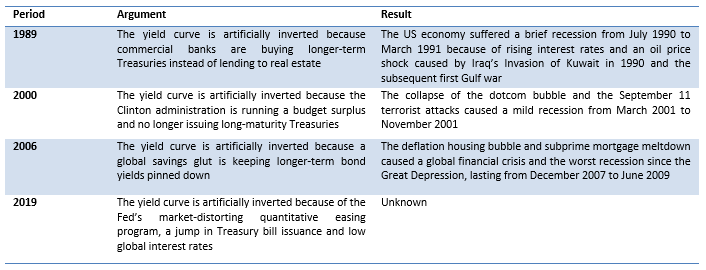
Historically, pundits have always found reasons to downplay the significance of yield curve inversions (Table 1). This time is no different: An argument persists, suggesting that the relationship between the slope of the yield curve and the business cycle may have now changed due to unique current circumstances, including the unusually low risk premiums holding down interest rates. However, this paper empirically shows that one should take the short-lived yield curve inversion as a warning signal. An inverted yield curve can reflect lower future economic expectations and hint at a palpable conjunction of both reduced economic health and future growth. Secondly, it can also be a symptom of the Fed driving up shorter-term rates too high, which, in turn, could lead to a contraction in both lending and the economy.

Table 1: Yield curve inversions: a summary

Table 1: Yield curve inversions: a summary

Source: Financial Time

To assess the reliability of the signal, we computed four logistic regressions based on four yield curve metrics as proxy variables for the term structure of the U.S. yield curve. We found that:

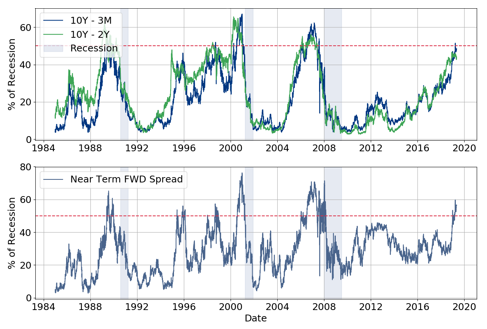
  1.  When using the 10-year treasury yield minus 2-year treasury yield, the probability of a recession at current term spread is 43%;
  2. When using the 10-year treasury yield minus 3-month treasury yield, the probability of a recession at current term spread is 50%;
  3. When using the Near Term Forward Spread (18-month forward spot yield minus 3-month Treasury yield), the probability of a recession is 58%; and
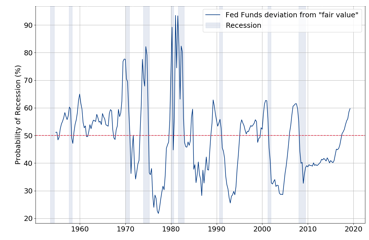
  4. When using the Fed Funds rate deviation from equilibrium, the probability of a recession is 60%.

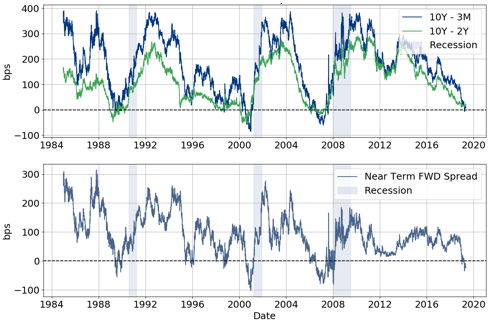
Note that we could have used the 10-year treasury yield minus 1-year treasury yield as shown in Figure 2 as most metrics are yielding similar results. Also note that recession probability signaled by the three term spreads is consistent with former turning point levels. This becomes more visible when one uses the Near Term Forward Spread metric alone (Figure 5). Last, though all indicators confirm the likelihood of a recession, timing it with precision (lapse between inversion and contraction for e.g.) is not statistically significant.

Figure 4: U.S. term spreads

Figure 4: US term spreads

Source: Bloomberg, Allianz Research

Figure 5: Recession probabilities based on Term Spreads

Figure 5: Recession probabilities based on Term Spreads

Source: Bloomberg, Allianz Research

Figure 5 shows that the Near-Term Forward Spread generated two false signals (first in 1995, then in 1998). Looking at those two short-lived inversion periods, one can argue that the nature of those misleading signals was not only different, but completely unrelated to U.S. domestic matters. In 1995, the U.S. economy was confronted with the exogenous shock provoked by the Mexican peso crisis. Moreover, at that point, the length of the U.S. expansion was only four years long. In the case of the 1998 inversion, a similar story holds. The (near) inversion was due to the exogenous shock provoked by the Russian financial crisis. While Brexit and the U.S.-China trade tensions might be compared to the 1995 or 1998 exogenous shocks, we consider that current economic conditions (late-late cycle stage and most economic indicators point towards slower U.S. activity) are different from those prevailing at the time of these two erroneous signals.

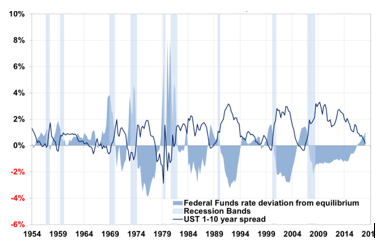
As for Fed Funds deviation (Figures 6 & 7), an inverse correlation between the deviation of the Federal Funds rate from its equilibrium (fair value) and the U.S. term spread is directly observable. This indicator strongly suggests that the U.S. tends to enter into economic downturn periods when the Fed raises policy rates too high (i.e. when monetary conditions are too tight). By having a closer look at Figure 6, it seems plain that the Fed has overreacted to current economic conditions as much as it had in 1990, 1999 and 2007, before the last three recessions. It is worth mentioning that one of the most valuable advantages of Fed Funds is that the volatility of its estimate is far lower than that embedded in the other three variables used in this analysis, allowing for a clearer picture of what is ahead.

Figure 6: Fed Funds deviation from equilibrium

Figure 6: Fed Funds deviation from equilibrium

Source: Allianz Research, Bloomberg

Figure 7: Recession probabilities based on Fed Funds “fair value”

Figure 7: Recession probabilities based on Fed Funds “fair value”

Source: Allianz Research

Is this signal going to persist?

To see how the shape of the yield curve is likely to develop, and whether it will continue implying that a recession is on the horizon, the behavior of the short and long end of the curve are analyzed separately. When it comes to the short end of the curve, the latest Federal Reserve economic projections show the central tendency projections for 2019 at 2.4-2.6% and its long-run projected value at 2.5-3.0%, meaning that the short-end of the curve is believed to remain anchored at around 2.5% in 2019 and 2020.(See Table 2). Similarly, economists forecast the short end of the curve to remain at 2.50% for both 2019 and 2020 (Bloomberg).

Table 2: U.S. Federal Reserve economic projections

Table 2: US Federal Reserve economic projections

Source: U.S. Federal Reserve

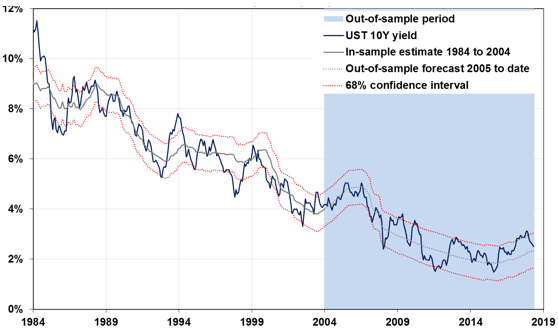
Shifting to the long end of the curve (represented by the 10Y U.S. Treasury yield), a Bloomberg survey shows that most economists expect a mild pick-up in long-term yields, with 10Y Treasuries at 2.75% by the end of 2019 and at 2.87% by the end of 2020. However, according to the results of our proprietary model, the long end of the yield curve is close to its intrinsic fair value of ~2.5% (Figure 8). According to this model, the elasticity of the U.S. 10Y yield “fair value” is low, implying that the long end of the curve seems to be fairly sticky and is unlikely to move in either direction.

Figure 8: 10-year U.S. yield fair value

Figure 8: 10-year U.S. yield fair value

Source: Bloomberg, Allianz Research

Taking both the short and long end of the curve projections into account, the U.S. yield curve will likely remain flat at best in the near future. Building on this premise, another round of yield curve inversion is possible if the Fed turns out to be slow to ease its monetary policy.  Given the uncertainty generated by the yield curve inversion, a downside risk management strategy may be warranted to shield portfolios and perform during a likely downturn.

Fixed Income Strategist