2019 was a good year and provided a good hand-off to 2020

The North Report: 2019 and 2020

Despite some bumps along the way, 2019 was a solid year all around for the economy, for business, for the consumer, and for the financial markets. For 2020 however, while we expect positive growth, it will be markedly slower. We may even experience a quarter of flat or negative growth, but the odds of a recession are waning.

One of the major supports for the economy for the entire recovery has been somewhat overlooked because it has become the “new normal”, and that is low-interest rates and low inflation. It’s hard to imagine now in a world of stable 2% inflation, but in 1974 inflation was running at 12% y/y and in 1984 it reached 15%. Mortgage rates which are now less than 4% reached an unthinkable 19% in 1981. It’s also hard to overstate the beneficial effects to consumers and to businesses of low and stable inflation and interest rates, even if savers and lenders are somewhat less well off. And the best news is that low inflation and interest are likely to continue on and support the 2020 economy.

It’s also hard to overstate the importance of the services sector which comprises about 80% of the economy.  Historically services have not only grown faster but have also been more stable than the goods sector, offering a solid foundation for growth. That was certainly the case in 2019, and again, given its stability, we expect that to be the case in 2020 as well.

The housing market, which was a drag for part of 2019, has seen a sharp rebound over the past few months. Sales, starts, and permits have all taken a leg up, largely due to lower mortgage rates which declined throughout 2019. 

housing sales


The Federal Reserve also initiated a series of three cuts to short term interest rates in July of 2019 after economic data suggested a slowing economy, and the yield curve had inverted. Since it can take from six months to a year for monetary policy actions to have full effect on the economy, so those cuts will help support the economy in 2020. But they may not be enough to counteract the headwinds of slowing global growth, trade tensions, and fading fiscal stimulus.

There is no question that the economy was in fine shape at the end of 2019, and many indicators demonstrate currently robust conditions. But the keyword is “currently”. Some of the same indicators are also giving us concerns about the future, including interest rates, consumer behavior, and the labor market.

There are still significant risks for 2020.

Interest rates are currently low and are positive for the economy, as mentioned above. But the behavior of the interest rate yield curve earlier in 2019 gives us a warning for 2020. The curve inverted in May, meaning the 10-year yield was lower than the 3-month yield, and it and stayed inverted for five months. Over the past 50 years, an inverted yield curve has been a perfect predictor of the past seven recessions. Typically there is a three to five quarter lag between when the curve inverts and when a recession starts, and if that pattern were to hold true, it would put a slowdown somewhere in the first half of 2020. And the fact that the curve has now gone positive is not an argument against its predictive powers because in five of the past seven recessions, that has been the pattern – the curve inverts, then goes positive, and then the recession comes. Note that we are using the term “slowdown” instead of a recession. One reason we are hedging our bets is that because of the unconventional monetary policy over the last decade, where we are coming off a 0% Fed Funds rate, historical patterns may not hold up perfectly. 

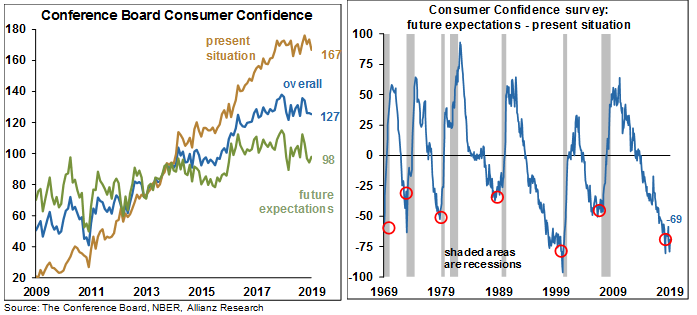
Similarly, the Conference Board’s Consumer Confidence Index is currently at a very high level historically which is typically a sign of strength for consumption.  But the index has fallen for four consecutive months, and five of the past six.  More importantly, two components of the survey, present situation and future expectations, are diverging sharply. The difference between the two is shown as the blue line in the right-hand chart, and when that line gets very negative, it means people are much more concerned about the future than they are of the present, and they are usually right – a recession usually follows.

the Conference Board’s Consumer Confidence Index


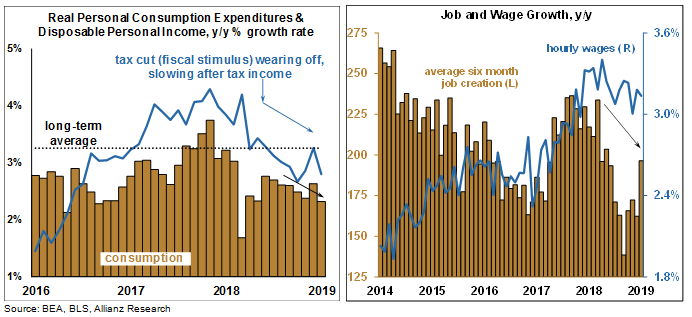
And it would appear that consumers’ actual behavior is being guided by expectations for the future because total consumption is not only running below average, it’s trending down as well. On top of concerns about the future, another weight on consumption is that growth in real, after-tax, disposable income is also stalling. That downshift can be explained in part by the fact that the effects of last year’s tax cuts, a form of fiscal stimulus, are now drying up. Since there is no tax cut this year, growth in taxes is returning to previous levels, leading to a decline in after-tax income growth.

Another weight on income is growth in hourly wages—which is now running at a decent 3.1% y/y—but is down from 3.4% in February. In turn, that slowing wage growth is due in part to the deceleration in job creation from 1.9% y/y at the beginning of 2019 to 1.5% currently. A decline in job growth has historically been associated with a recession, and in all 11 of the previous recessions over the past 70 years, job growth was actually faster than it is now. There are some other less visible signs of decay in the labor market as well. Job openings have fallen 4.7% over the past year, effectively breaking a 10 year upward trend. Weekly jobless claims are up 11% since April and recently jumped the most in over two years. Finally, the number of job quitters has fallen 4.3% over the past two months, indicating less confidence among workers that they will be able to find a new job easily. 

Jobs and wages graphs


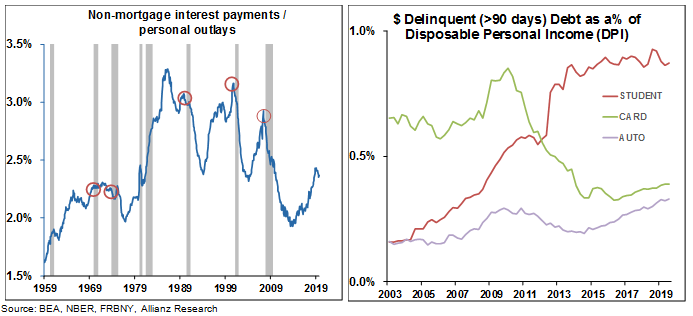
The consumer is also facing an additional burden from interest payments. Despite the Fed cutting interest rates over the past six months, credit card rates remain sky-high at an average annual rate of 17%. In addition, the amount of outstanding student debt has soared. The combination has resulted in rising levels of interest payments as a percent of all personal outlays. In fact, in January that percentage reached the highest level since the recession, and although that percentage has turned down slightly since then, it follows previous patterns that suggest an imminent slowdown. When consumers have to pay more interest on their debts, it leaves less money available to spend on other goods and services to support the economy. In addition, consumer delinquencies on such debt are on the rise, surely a drag on the consumer.

consumer delinquencies


The trade situation has created a great deal of uncertainty and has caused business investment to fall in Q2 and Q3. In addition, total merchandise exports have declined by 0.6% in the past 12 months compared to the previous 12 months. As a result, manufacturing has been suffering. The ISM manufacturing index has been under the 50 level signaling contraction for four consecutive months, manufacturing industrial production is down 0.8% y/y with 13 of 19 sub-industries in contraction, core orders for durable goods are down 0.8% y/y, and shipments of those orders, which are a part of the GDP calculation are only running at 0.4% y/y. Perhaps more importantly for the future, manufactured goods have to be shipped, and shipping indicators, which lead the economy, are all in decay. Freight hauled by trucks, carried by rail, or moved in and out of our ports by ship is all in sharp decline. All of this manufacturing and shipping data could turn more positive relatively quickly if trade negotiations with China were to be finalized immediately, but that seems unlikely. As of this writing, we are on the brink of a phase one-trade deal that would offer some relief on tariffs, but it is only a limited agreement, and it’s possible that the Chinese may drag out any more agreements on trade until after the November 2020 election. At the moment, we estimate that we are losing a bit less than 1% of GDP growth over two years due to this trade “feud”. However if we enter into a trade “war” where we put tariffs on all Chinese goods, and put tariffs on $200B of auto imports, and suffer retaliatory tariffs, we would be losing closer to 2% over two years. And in a world of 2%-ish growth, that’s a lot. 


ISM manufacturing index


Enjoy the current strength, but expect a slowdown in 2020

So the list of worrisome indicators is significant, but again, many of those same indicators show good business conditions at the moment. Consumer confidence is high overall, but consumer concerns over the future are significant. Overall consumption and personal income are both positive but slowing. Job creation is strong but is decelerating, and several other indicators in the labor market confirm this emerging weakness. Personal interest payments as a percent of total outlays have risen sharply, constraining spending on everything else. Trade uncertainty is driving down investment, manufacturing, and transportation. As a result, our overall scenario is one of positive, but sluggish, GDP growth of 1.6% for all of 2020. And it is possible that we may see a quarter of near-zero, or perhaps even negative growth in the first half of 2020, however, the chances of a full-blown recession are waning.

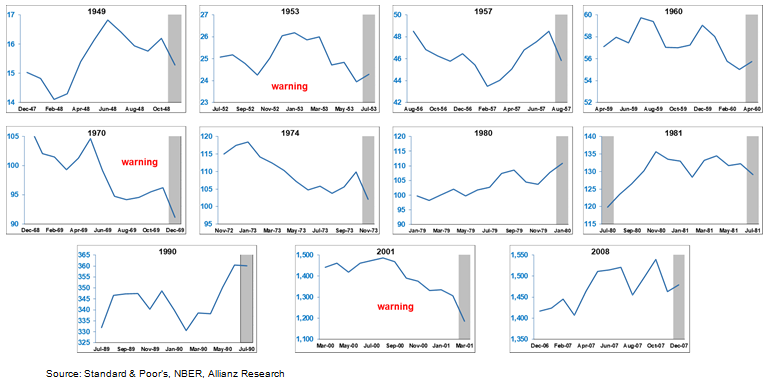
Our scenario is a bit less rosy than the consensus, and we suspect that this is because of the nature of our business. We ensure our clients against the possibility that the businesses they sell to won’t pay them back, or can’t pay them back due to bankruptcy, and the incidence of those events has been soaring. Perhaps more importantly, we know that increase is a strong leading indicator of the economy. Other analysts may be more focused on the steadily rising stock market which tends to create euphoria and an exaggerated sense of security about the economy. But historically the stock market is usually rising just before a recession. In fact, the S&P 500, shown in the charts below as the blue line, has only given a substantive warning about an impending downturn in just three of the past 11 recessions (shown as the gray columns) going back 70 years. So enjoy the rising stock market now and the currently strong economic conditions. But be aware that there will likely be a marked downshift in 2020.

The S&P 500 12 Months Before the Last 11 Recessions

stock market
We're always producing new content to help businesses understand economic trends and navigate trade uncertainty.
Sign up for our newsletters to make sure you don't miss anything.