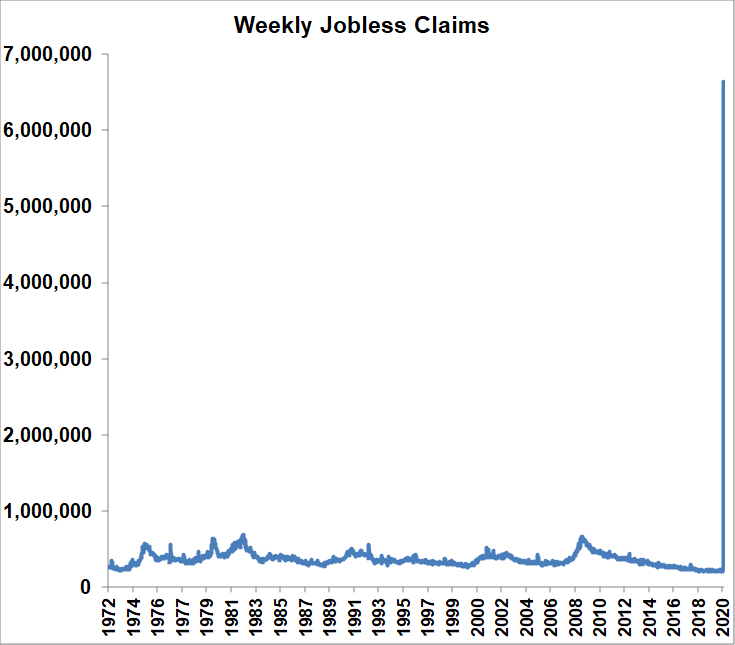
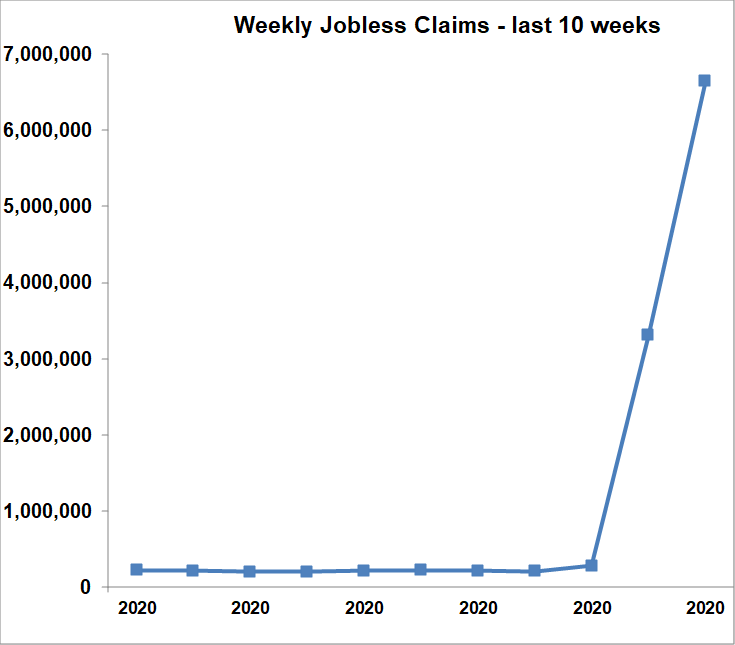
- Initial jobless claims soared last week to 6,648,000, twice as much as the previous record set last week, and twice as much as expected.
- That’s 19 times as much as the average over the past 53 years (before the last two weeks).
- It’s 10 times as much as the previous record (before the last two weeks).
- It brings the total number of Americans who have suddenly become unemployed over the past two weeks to 9,955,000. That’s 6% of the labor force.
- The first chart shows the long term, while the second chart shows just the last 10 weeks, so it’s easier to see the massive increases.
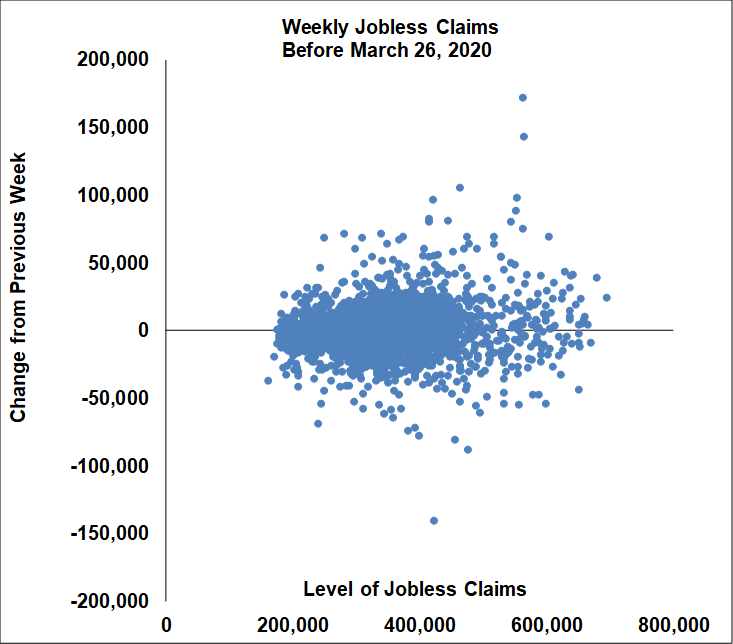
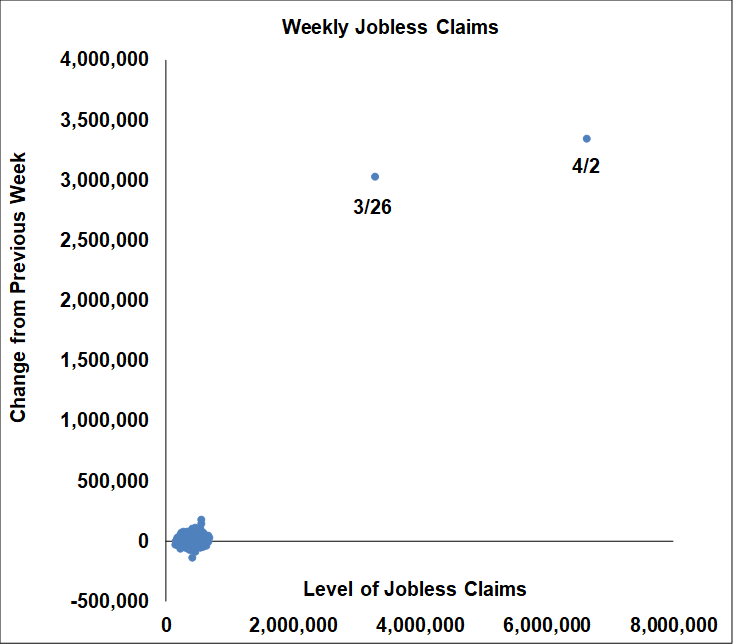
- These charts shows the level of claims vs. the weekly change. Each dot is a particular week in time, going back to 1967
- The first chart is before the last two weeks.
- The second chart includes the past two weeks, which of course necessitated a change in scale.
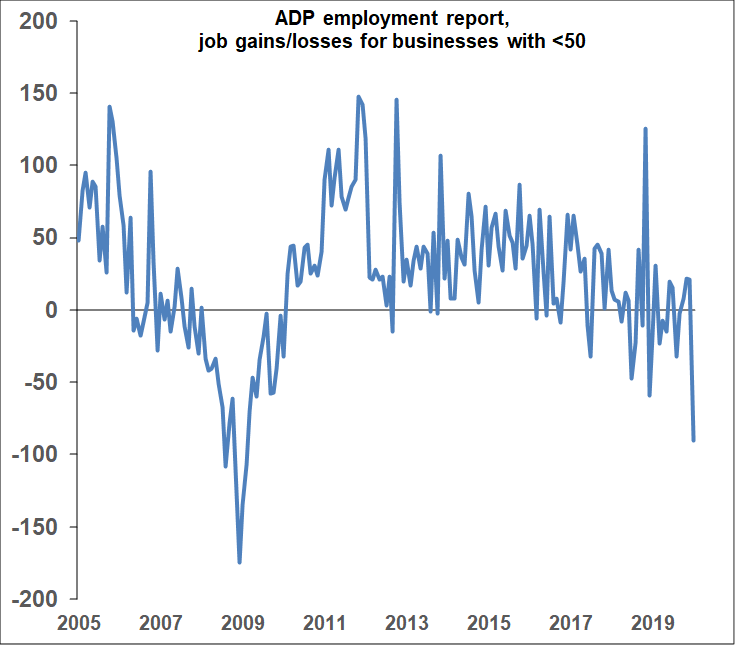
Separately, yesterday’s ADP employment report (which in the long run correlates with the government’s big employment report, issued tomorrow), broke out job losses by size of company. All the losses were in small companies with less than 50 employees, and the 90,000 decline was the worst since the Great Recession.
Get economic & trade content in your inbox
We're always producing new content to help businesses understand economic trends and navigate trade uncertainty.
Sign up for our newsletters to make sure you don't miss anything.
Sign up for our newsletters to make sure you don't miss anything.


