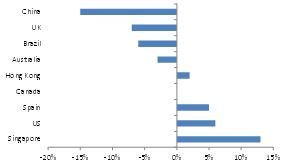
Global housing prices have hit an all-time high, on aggregate 58% above pre-crisis levels. This raises questions as to the risk related to bubbles in the housing sector. In order to gauge such risk, we have developed a simple model using unemployment, disposable income and mortgage rates to determine whether the housing sector in a given country is over- or under-valuated compared to fundamentals. We see mild overvaluation of global house prices in the order of 4% on average globally. We identify three groups of countries:

  • Overvalued: Singapore (13%), the U.S. (6%) and Spain (5%). Overvaluation in Singapore is close to historic highs and this therefore implies a risk of correction. In the U.S., overvaluation is much below the historic high of 26% (2006) and so we perceive much lower risk in comparison to that period.
  • Fairly valued: Canada, Hong Kong. These markets have corrected recently as result of regulations (Canada) or a challenging economic environment (Hong Kong).
  • Undervalued: The UK (7%) Australia (3%), Brazil (6%) and China (15%). The UK has swung into undervaluation post Brexit vote and a significant London slowdown. Meanwhile, the undervaluation in Australia and China are largely a result of policy, such as taxes and regulations.

A long rising streak, record high house prices and key indicators imply risk ahead

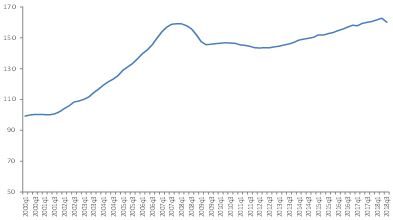
House prices have seen an uninterrupted rise since the global financial crisis and now stand 60% above pre-crisis levels, on par with the highs of the global financial crisis on aggregate globally. Notably, average house prices have increased by 58% since the post-crisis trough in the U.S., 60% in Australia, 81% in Canada and 148% in Hong Kong. On average, housing upturns tend to span a seven to ten year period. This suggests that the current housing cycle, now in its eighth year, could be in a late stage.


Figure 1 – Global house prices index
Source: Knight Frank

Traditional arguments explain tight housing markets and elevated prices with four main factors: Demand strength primarily based on strong job markets, supply shortage, credit conditions and a non-fundamental factor.

Housing demand is strong, based on tight job markets

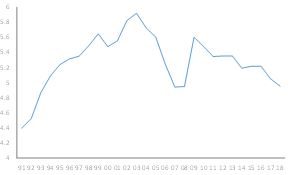
Employment is a prime driver of housing prices as demand factor. Globally, unemployment stands at record lows at 5%, the lowest level since 2007. Such an environment is conducive to tight housing markets globally.

Fig 2 - Global unemployment (%)
Source: World Bank

A shortage of supply has reduced affordability

Structurally, a significant supply shortage has contributed to this situation: housing stock development has not kept up with population growth. The issue is significantly more pronounced in global hotspots of demand, i.e. a number of major metropoles, where urbanisation and concentration of demand upon prime property and city centres – in a move away from more diverse and suburban housing demand – have driven up prices much above national averages.

We interpret poor and declining affordability as one concerning indicator of shortage of supply. Housing affordability has declined in almost all major developed countries over the past five years. Over 50% of all countries in the world have seen housing becoming more unaffordable since the global financial crisis as shown in Figure 3 below.

Figure 3 – House price to income ratios in selected countries
Source: IMF

Loose credit conditions push up housing prices

Low interest rates in most markets alongside ample mortgage financing availability are a major driver of current house prices. The number of central banks having eased the stance of their monetary policy over the last few months is as high as in 2009, while our world average official interest rate is at a one-year low.

Speculative or non-fundamental factors are at work

Speculative or non-fundamental elements comprise two aspects, high risk appetite in the financial industry and beyond, and macro regulation.

  • Risk investment strategies

Quantitative easing, with its inherent abundance of liquidity and quest for investment opportunities outside of highly valued bonds and equities, has led to unprecedented capital inflows into the real estate, infrastructure and construction sectors. In a very basic equation, one abundant cheap good, cash, chases another scarce and increasingly pricey good, property.  In 2018, assets under management by real estate investment funds reached an all-time high, exceeding USD 900bn, the sixth consecutive year of annual funds raised surpassing USD 100bn pa. And issuance of U.S. collateralised loan obligations, another key real estate financing vehicle, is on track to match, if not exceed, last year’s USD 14bn. A large portion of yield-seeking capital has flown into the luxury segment. City centres will be a prime drawing point and investment capital inflows have led to a significant premium for desirable demand hot spots.

Figure 4 – Fund inflows into the real estate sector: Real estate funds’ assets under management and U.S. CLO issuance
Source: inrev, Trepp
  • Macro regulation has capped rents

Rental yields have been declining consistently and are now at levels that are unattractive in a number of locations. Rents have in general progressed at a much slower pace than house prices, partially due to restrictions such as index referencing and capping. For example, with the latest rent cap in Paris, set in early 2019, an average property would yield between 2.7% and 3.8%, while the freshly confirmed cap on rents in Berlin is set to freeze rental yields for five years at levels around 2-3%. There is of course an additional upstream/development margin for integrated companies. Yet, these examples compare to the average Weighted Average Cost of Capital in the REIT sector of 4-6%. We see risk for more intervention in the form of rent control as inequality and populism increasingly shape the political agenda.

Figure 5 – Rental yields 
Figure 5 – Rental yields
Source: National statistics offices, Globalpropertyguide, Euler Hermes/Allianz Research

House price valuation model indicates mild house price overvaluation

We have identified four factors as key drivers of housing valuations: Demand (driven by job market conditions), supply, credit conditions and non-fundamental factors. In order to judge the extent of over- or undervaluation, we estimate fundamental value housing prices on the basis of these factors. We reflect these factors through using unemployment, mortgage rates, household income and rents as input variables for our model.

We identify the non-explained part of our model (the residual), with the non-fundamental factor (pursuit of capital gains or state intervention). We then calculate the ratio between the explained part of our model and actual observed data. Above one, this ratio shows overvaluation of house prices; below one, it shows an undervaluation. We calculate this for each country that we have considered, and then aggregate into a global index made up of 13 countries.

We see mild overvaluation of house prices on a global basis, in the order of 4%. Note that we have excluded China from this analysis. Including China, our global house price valuation index shows 2% undervaluation, as a result of about 15% undervaluation in China. An important takeaway is that the risk of a correction is rather limited at a global level for now.

Figure 6 – Global house price valuation index 
Figure 6 – Global house price valuation index
Source: National statistics, Bloomberg and Euler Hermes, Allianz Research
We find the greatest degree of overvaluation in Singapore (13%), followed by the U.S. (6% as of Q1 2019) and Spain (5%). Canada and Hong Kong fairly valued. All of those markets have corrected recently as result of regulations (Canada) or a challenging economic environment (Hong Kong). In contrast, The UK, Australia, Brazil and China appear the most undervalued. In China, house prices have been largely flat since 2017 as a result of government restrictions, while employment remained strong and interest rates low. (See appendix for a full list of valuations for our sample countries.)
Fig 7 – Global house price valuations
Source: Euler Hermes, Allianz Research

Our model correctly identifies periods of overvaluation (see Appendix). We found it instructive to analyse the contribution of our selected economic drivers to housing valuations: Unsurprisingly, unemployment and mortgage rates are highly significant variables, more so than rents. However, we have analysed periods of disconnect, i.e. where house price overvaluation increases despite falling mortgage rates and/or unemployment or in excess of the movement that we would have expected as a result of a change in our two main driving variables. With a few exceptions, such a disconnect has occurred  around the financial crisis of 2008 and from 2016.

Overvaluation focus: Singapore, U.S.

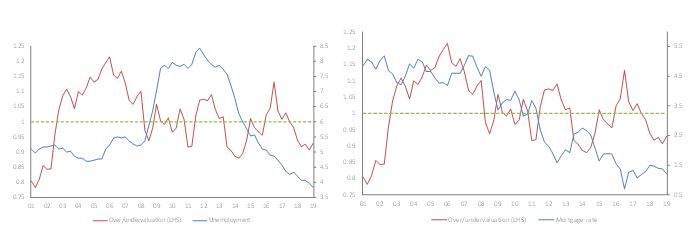
The U.S. in Q1 2019 showed as overvalued to the tune of 6%, but within what we consider a corridor where risk is contained in our opinion, i.e. less than 10% overvaluation. The recent deceleration observed in housing prices suggests that this mild overvaluation has progressively corrected in 2Q/3Q 2019 alongside the deceleration of the U.S. economy. This time is therefore different compared with 2007-09, when house prices expanded significantly beyond what would have been justified by fundamentals. The presence of excess liquidity, through loose lending standards at the time, was the prime reason. Other indicators prove the point: Home mortgage liabilities peaked at a record USD 10.6tn in QQ4 2007, double the level of five years earlier (source: St Louis Fed). Going forward, we expect the pattern of loose monetary policy and yield-seeking capital pushing up housing values to offset the negative impact of lower growth.

Figure 8 – U.S. housing valuations and key economic drivers
Figure 8 – U.S. housing valuations in function of key economic drivers
Source: Euler Hermes, Allianz Research
Currently 13% overvalued, we note a decoupling from fundamentals in Singapore: Until 2010, we can observe a tight correlation of housing with fundamentals as we would expect. Post 2010, we find large upswings in value - +20% 2010 and +13% since 2017 – that are unlikely fully explained by our main variables. We attribute these to demographic trends – population growth – and investment purchases.
Fig 9 – Singapore housing valuations and key economic drivers
Fig 9 – Singapore housing valuations in function of key economic drivers
Source: Euler Hermes, Allianz Research

Fairly valued focus: Canada, Hong Kong

Canadian house prices are no longer overvalued post the most recent correction. We are inclined to again see institutional liquidity as the reason for the prior decoupling.  The 90bps increase in mortgage rates through 2017/18 and the introduction of a foreign buyer tax, have certainly been major factors underlying the correction.

Figure 10 – Canada housing valuations and key economic drivers
Figure 10 – Canada housing valuations in function of key economic drivers
Source: Euler Hermes, Allianz Research
Our model indicates Hong Kong is about fairly valued. Historical analysis based on fundamentals does not suffice to explain the important swings in the housing market. Government supply restrictions led to past overvaluation with normalisation since 2010 when those restrictions were eased. Besides, the influence of the Chinese investment cycle has been visible since 2014 with overvaluation in 2016-18 and a correction in 2019.
Fig 11 – Hong Kong housing valuations and key economic drivers
Fig 11 – Hong Kong housing valuations in function of key economic drivers
Source: Euler Hermes, Allianz Research

Undervaluation focus: UK, Australia, China

The UK shows as undervalued following the post Brexit correction. The turn in valuation almost exactly coincides with the Brexit referendum. Correction in the central London high-end segment has been a factor while the mid-market has also seen weakness as a result of Brexit and broader economic uncertainty.

Figure 12 – UK housing valuations and key economic drivers
Figure 12 – UK housing valuations in function of key economic drivers
Source: Euler Hermes, Allianz Research
In Australia, we saw an important disconnect of house prices from fundamentals in the run up to the financial crisis where excess liquidity and loose lending standards dominated markets. We highlight 2017/18 and the strong increase in house prices, in our view again stemming from values driven up by investment activity, as in many other regions. High levels of household indebtedness underpin that view. It was policy action (taxes, curbing foreign investment) that corrected the market.
Fig 13 – Australia housing valuationsand key economic drivers
Fig 13 – Australia housing valuations in function of key economic drivers
Source: Euler Hermes, Allianz Research
The Chinese market has been disconnecting from fundamentals since 2015. The 33% rise in valuation we observe between 2015 and 2016 is in our view driven by very large credit stimulus at the time. Quest for capital gain on the households’ side was clearly at work as investing in real estate was a way to generate strong returns beside investment into equity. In an attempt to control housing prices, the Chinese government implemented a catalogue of interventions. Already since 2013, the government attempted to control speculation in the Chinese housing market and support affordability. Tier 1 and 2 cities were largely the target of these restrictive policies. They included but were not limited to higher transaction taxes, minimum holding periods, removal of tax exemptions, raising housing-loan credit standards and imposing limits on the ability to own multiple properties. There were also restrictions on property ownership by non-residents of certain cities and regions. Moreover, more land was made available for affordable housing. The government further required developers to build low and mid-range long-term leasing properties in the major cities. During 2016, another set of restrictions on investment properties was imposed in 21 cities and in 2017 down payment requirements even for first time buyers increased. From that point onwards, the impact of these restrictive policies became clearly visible. As a result of them, fundamentals tell us that housing prices in China are now on average 15% under-valued, which potentially represents a possible target for supporting growth in the short-term, should macroeconomic conditions deteriorate rapidly.
Fig 14 – China housing valuations and key economic drivers
Fig 14 – China housing valuations in function of key economic drivers
Source: Euler Hermes, Allianz Research
Sector Advisor for Energy, Metals, and Machinery and Equipment
catharina.hillenbrand-saponar@eulerhermes.com
Head of Economic Research
Economic Research Assistant